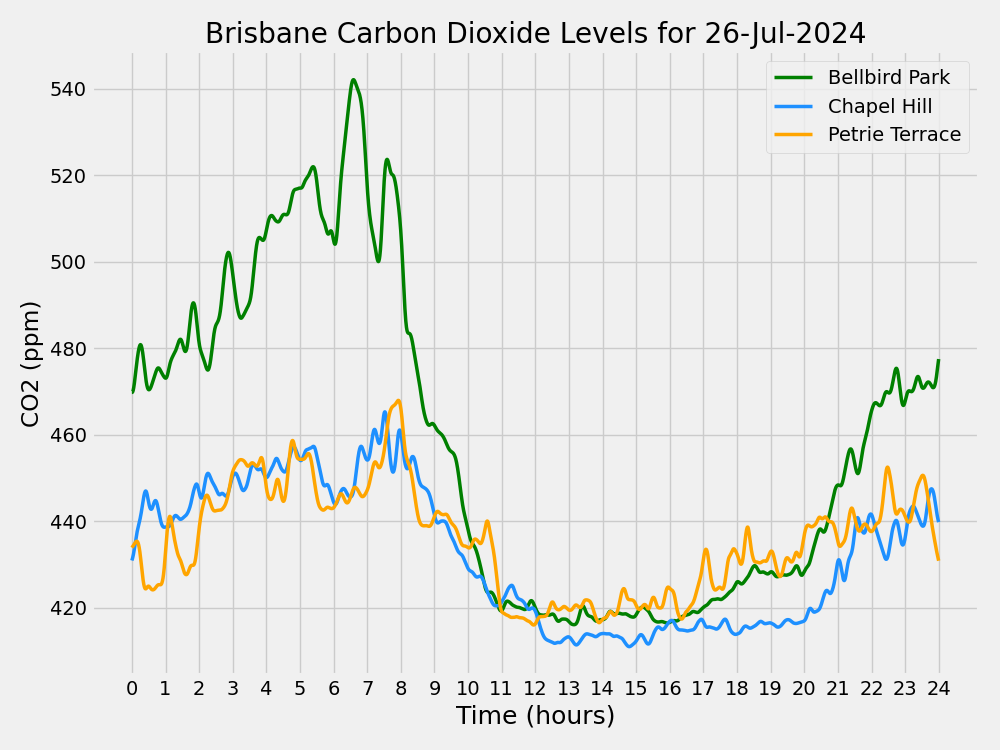
Brisbane's average carbon dioxide concentration for 28 March 2024: 452 ppm.
Average for 2023*: 437 ppm.

*Average of calendar year’s observations – based on three phases of data collection with different calibrations and incomplete data (64% complete).

With additional sites, we can learn more about Brisbane’s CO2 levels and their associations with weather, traffic etc. If you are interested in hosting a sensor, please contact us here.  

Daily profiles

More symmetric daily profiles on Thursday for the three stations currently reporting – and a small rise in average values.

A network of sensors that includes carbon dioxide measurement is being installed in Providence, Rhode Island, adding to the handful of cities with continuous monitoring: https://www.breatheprovidence.com/.

Globally, 2024 continues to show some exceptional temperatures.  For example, global sea surface temperatures continue to run about four standard deviations above the mean fro 1982-2011 (dark line, top left):

Source: https://climatereanalyzer.org/clim/sst_daily/


Why do levels change across the day?  Although patterns vary considerably, levels normally rise overnight as the top of the atmospheric boundary layer is closer to the ground. At daybreak, the boundary layer rises and winds bring in ‘cleaner’ air from higher levels, while photosynthesis also reduces carbon dioxide levels, until the sun goes down.

Learning about traffic-related emissions in Brisbane

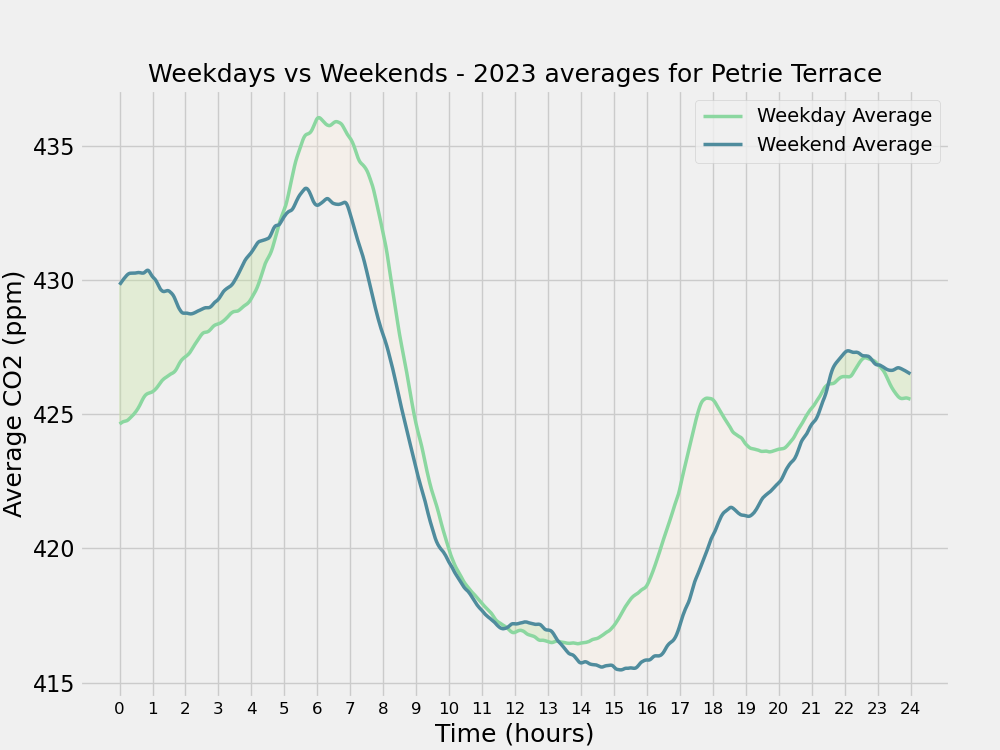
Average levels measured at Petrie Terrace for weekdays were higher than for weekends in the morning and afternoon/evening commuting times, but lower in the early morning hours.  Differences in traffic emissions are the likely explanation.  (Note: some missing days during 2023). Strong similarities with data using much more sophisticated measurements, from Mexico City and Munich (below) including the reversal from early morning to the afternoon and evening. (González del Castillo, E. et al. (2022) ‘CO2 variability in the Mexico City region from in situ measurements at an urban and a background site’, Atmósfera, 35(2), pp. 377–393. Available at: https://doi.org/10.20937/atm.52956.) & Lan, L. et al. (2020) ‘Assessment of Urban CO2 Measurement and Source Attribution in Munich Based on TDLAS-WMS and Trajectory Analysis’, Atmosphere, 11(1), p. 58. Available at: https://doi.org/10.3390/atmos11010058.). 

Another way of viewing this is to subtract weekend values from weekday values.  This shows the morning and afternoon/evening commuting time peaks very clearly.   

Why do weekdays have lower values than weekends in the early morning?  Sunday ends low, which runs into Monday morning and brings down the weekday average for those early hours. Saturday ends high (perhaps because of late evening entertainment-related traffic), which runs into Sunday morning and elevates the weekend values in those hours.

The increment of 4-6 ppm for weekdays compared to weekends doesn’t indicate the total effect of traffic emissions as it is just a difference score – even on weekends the city centre has a high traffic load.

This analysis shows the value of targeted comparisons – even though our low-cost equipment limits the accuracy of measurements (and therefore inferences about data from different sites), comparisons made over the same time-period can be made with much greater confidence. 

DateKelvin GrovePetrie TerraceChapel HillBellbird Park
28-03-2024445 ppm456 ppm455 ppm---
27-03-2024441 ppm444 ppm440 ppm---
26-03-2024450 ppm---446 ppm---
25-03-2024457 ppm---454 ppm---
24-03-2024445 ppm448 ppm444 ppm---
23-03-2024439 ppm444 ppm435 ppm447 ppm
22-03-2024434 ppm438 ppm425 ppm419 ppm
21-03-2024445 ppm448 ppm441 ppm440 ppm
20-03-2024450 ppm457 ppm456 ppm457 ppm
19-03-2024438 ppm445 ppm441 ppm446 ppm
18-03-2024436 ppm440 ppm432 ppm435 ppm
17-03-2024436 ppm441 ppm431 ppm439 ppm
16-03-2024436 ppm425 ppm438 ppm419 ppm
15-03-2024448 ppm455 ppm446 ppm471 ppm
14-03-2024447 ppm454 ppm443 ppm439 ppm
13-03-2024442 ppm443 ppm436 ppm426 ppm
12-03-2024442 ppm444 ppm436 ppm423 ppm
11-03-2024445 ppm445 ppm442 ppm441 ppm
10-03-2024439 ppm443 ppm435 ppm427 ppm
09-03-2024441 ppm442 ppm434 ppm439 ppm
08-03-2024444 ppm449 ppm441 ppm435 ppm
07-03-2024449 ppm454 ppm449 ppm464 ppm
06-03-2024450 ppm455 ppm450 ppm471 ppm
05-03-2024446 ppm449 ppm442 ppm464 ppm
04-03-2024458 ppm462 ppm456 ppm473 ppm
03-03-2024449 ppm450 ppm442 ppm457 ppm
02-03-2024448 ppm449 ppm437 ppm447 ppm
01-03-2024449 ppm453 ppm441 ppm446 ppm
29-02-2024453 ppm456 ppm446 ppm456 ppm
28-02-2024450 ppm456 ppm453 ppm454 ppm
27-02-2024450 ppm449 ppm456 ppm441 ppm
26-02-2024452 ppm453 ppm456 ppm467 ppm
25-02-2024453 ppm453 ppm454 ppm455ppm
24-02-2024467 ppm468 ppm462 ppm477 ppm
23-02-2024457 ppm458 ppm446 ppm451 ppm
22-02-2024456 ppm455 ppm450 ppm473 ppm
21-02-2024458 ppm455 ppm455 ppm476 ppm
20-02-2024454 ppm451 ppm454 ppm456 ppm
19-02-2024461 ppm460 ppm456 ppm473 ppm
18-02-2024452 ppm454 ppm462 ppm
17-02-2024453 ppm451 ppm461 ppm
16-02-2024449 ppm445 ppm466 ppm
15-02-2024448 ppm450 ppm436 ppm
14-02-2024454 ppm447 ppm451 ppm
13-02-2024454 ppm449 ppm429 ppm
12-02-2024452 ppm445 ppm442 ppm
11-02-2024448 ppm438 ppm439 ppm
10-02-2024448 ppm438 ppm444 ppm
09-02-2024444 ppm431 ppm426 ppm
08-02-2024446 ppm429 ppm419 ppm
07-02-2024444 ppm435 ppm426 ppm
06-02-2024445 ppm433 ppm436 ppm
05-02-2024442 ppm432 ppm429 ppm
04-02-2024451 ppm442 ppm458 ppm
03-02-2024452 ppm442 ppm433 ppm
02-02-2024447 ppm439 ppm451 ppm
01-02-2024446ppm432 ppm 430 ppm
31-01-2024446 ppm432 ppm425 ppm
30-01-2024447 ppm432 ppm435 ppm
29-01-2024451 ppm447 ppm458 ppm
28-01-2024449 ppm453 ppm452 ppm
27-01-2024443 ppm445 ppm448 ppm
26-01-2024443 ppm440 ppm452 ppm
25-01-2024447 ppm442 ppm447 ppm
24-01-2024441 ppm438 ppm432 ppm
23-01-2024436 ppm422 ppm418 ppm
22-01-2024451 ppm448 ppm450 ppm
21-01-2024451 ppm451 ppm435 ppm
20-01-2024445 ppm440 ppm433 ppm
19-01-2024452 ppm442 ppm437 ppm
18-01-2024--450 ppm452 ppm
17-01-2024--445 ppm438 ppm
16-01-2024--440 ppm439 ppm
15-01-2024--436 ppm434 ppm
14-01-2024--441 ppm439 ppm
13-01-2024--436 ppm431 ppm
12-01-2024--442 ppm431 ppm
11-01-2024--445 ppm434 ppm
10-01-2024--456 ppm447 ppm
09-01-2024--444 ppm437 ppm
08-01-2024445 ppm438 ppm
07-01-2024--436 ppm427 ppm
06-01-2024--425 ppm419 ppm
05-01-2024--444ppm445 ppm
04-01-2024--450 ppm445 ppm
03-01-2024424 ppm439 ppm434 ppm
02-01-2024430 ppm438 ppm442 ppm
01-01-2024435 ppm444 ppm444 ppm
31-12-2023432 ppm445 ppm439 ppm
30-12-2023439 ppm445 ppm436 ppm
29-12-2023450 ppm466 ppm462 ppm
28-12-2023445 ppm466 ppm469 ppm
27-12-2023435 ppm448 ppm446 ppm
26-12-2023435 ppm439ppm434 ppm
25-12-2023429 ppm441 ppm441 ppm
24-12-2023432 ppm442 ppm437 ppm
23-12-2023421 ppm436 ppm443 ppm
22-12-2023430 ppm432 ppm446 ppm
21-12-2023429 ppm442 ppm433 ppm
20-12-2023419 ppm431 ppm431 ppm
19-12-2023421 ppm430ppm429 ppm
18-12-2023424 ppm426 ppm
17-12-2023432 ppm445 ppm433 ppm
16-12-2023434 ppm444 ppm439 ppm
15-12-2023433 ppm439 ppm436 ppm
14-12-2023421 ppm427 ppm426 ppm
13-12-2023422 ppm433 ppm425 ppm
12-12-2023420 ppm434 ppm421 ppm
11-12-2023418 ppm428 ppm422 ppm
10-12-2023423 ppm438 ppm424 ppm
09-12-2023420 ppm436 ppm426 ppm
08-12-2023430ppm437 ppm438 ppm
07-12-2023431 ppm439 ppm438ppm
06-12-2023427 ppm436 ppm436 ppm
05-12-2023426 ppm433 ppm428 ppm
04-12-2023435 ppm445 ppm439 ppm
03-12-2023438 ppm453 ppm465 ppm
02-12-2023434ppm443 ppm442 ppm
01-12-2023444 ppm451 ppm459 ppm
30-11-2023447ppm464 ppm457 ppm
29-11-2023437 ppm437 ppm436 ppm
28-Nov-2023444 ppm448 ppm448 ppm
27-Nov-2023433 ppm436 ppm444 ppm
26-Nov-2023427 ppm435 ppm447 ppm
25-Nov-2023425 ppm430 ppm423 ppm
24-Nov-2023429 ppm442 ppm427 ppm
23-Nov-2023431 ppm442 ppm432 ppm
22-Nov-2023435 ppm437 ppm433 ppm
21-Nov-2023440 ppm436 ppm432 ppm

Phase 3 Data

(Table presents latest data, which may include revisions based on periodic recalibration of equipment, correction of errors, omissions, etc.)  Please note that data for Petrie Terrace between 21 Nov 2023 and 03 Jan 2024 will soon be revised in the next few days to account for drift in a sensor – now replaced).

Scroll to Top