Why monitor carbon dioxide in Brisbane and surrounds?
Cities are the world’s major sources of CO2, the most important greenhouse gas and driver of climate change. Brisbane is no exception, and CO2 levels are consistently higher than reported by, for example, NOAA at the Mauna Loa Observatory or CSIRO at the Kennaook/Cape Grim Baseline Air Pollution Station in Tasmania, which are designed to sample representative ‘well-mixed’ (not surface-level) air, without the influence of local greenhouse gas sources. Yet there is minimal information or public knowledge about CO2 at the local level. For example, its is not included in Queensland’s Ambient Air Quality monitoring as it’s not considered a pollutant even though its increase is causing serious climate effects. By measuring and reporting levels from sites in and around Brisbane, this citizen science project aims to broaden the community’s understanding of CO2 levels and trends, and put a local perspective on a global problem.
What can we learn?
– How concentrations vary across and around the city. Are CO2 levels highest near industrial areas? In the CBD? Motorways? Do bushland and parks reduce levels? Can we identify ‘sources and sinks’?
– How concentrations vary over time. There’s a fairly typical daily pattern to surface-level CO2 concentrations, but how does this vary by location? Is it the same in different seasons?
– How weather patterns influence CO2 levels. Do strong winds clear the air (disperse our emissions elsewhere)? Do long spells of calm weather increase CO2 concentrations?
These are some of the questions the project may help answer.
Equipment and analysis
The instruments used in this project are also much less sophisticated than those used by CSIRO, NOAA and other stations that contribute the the Global Greenhouse Gas Reference Network. We are using non-dispersive infra-red (NDIR) sensors (Senseair K30 and K33), that have a reported accuracy of ±30 ppm ±3% of reading. However, we are able to reduce the error substantially by using methods similar to those described by Martin C. et al. (2021), who reported errors from individual sensors from 1.6 to 4.4 parts per million (ppm) relative to a gold standard device. Our sensors are periodically calibrated with a known gas concentration and cross-checked to minimise error and allow comparisons between the different sites. However, the absolute level from any individual sensor should be regarded as indicative, and accurate to within a few (~5-8) ppm.
We have steadily improved the calibration process over the first three phases, currently using a calibration gas at 400 ppm and undertaking a span calibration with known carbon dioxide levels, and adjusting sensor readings for effects of relative humidity, pressure and temperature.
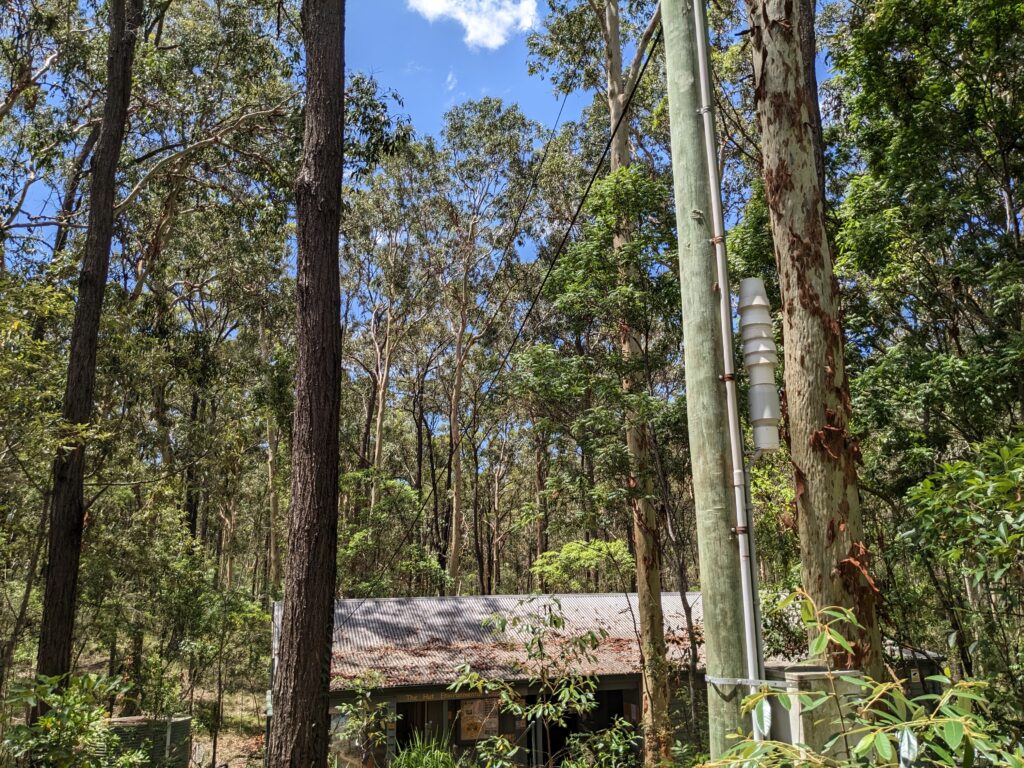
Each sensor station comprises a Senseair K30 sensor, a BME280 pressure, relative humidity and temperature sensor, and a Raspberry Pi Zero with internet connection, housed in a PVC tube with large ventilation apertures and housing to protect the electronics from direct rain or contamination. Data is sampled every 15 seconds, controlled by a program written in Python 3. Data is remotely accessed daily or as required via Pitunnel, and updates can be installed remotely via VNC and WinSCP. Analysis uses Python 3 with Pandas, Matplotlib and other packages, running on Jupyter Notebook.