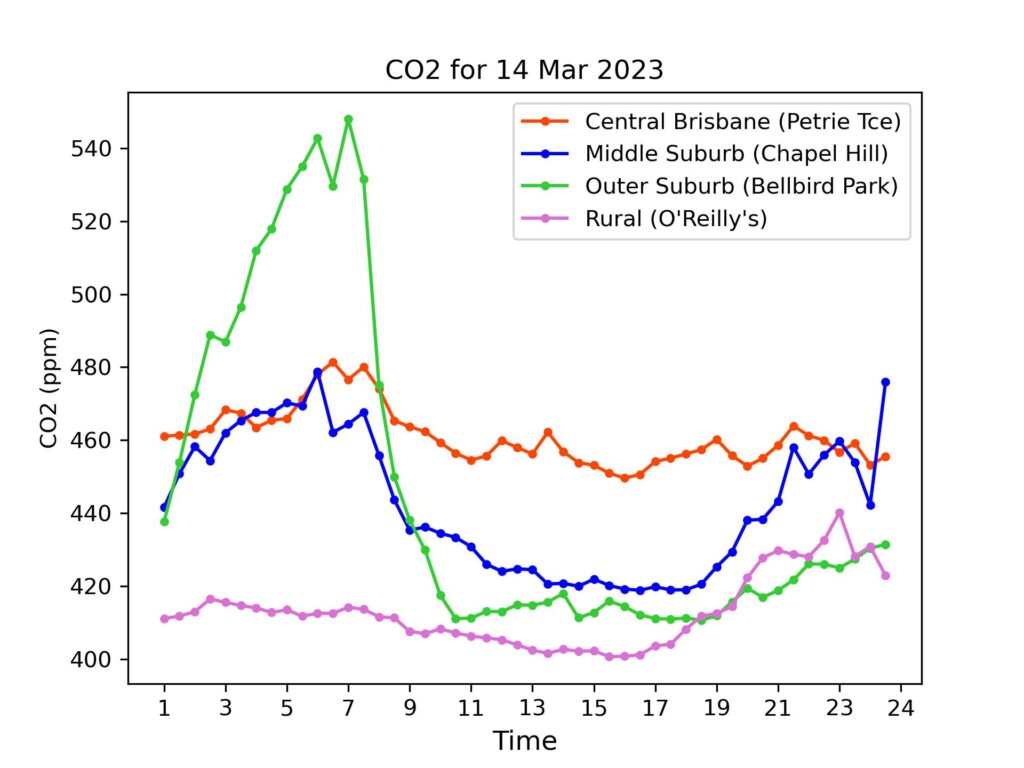
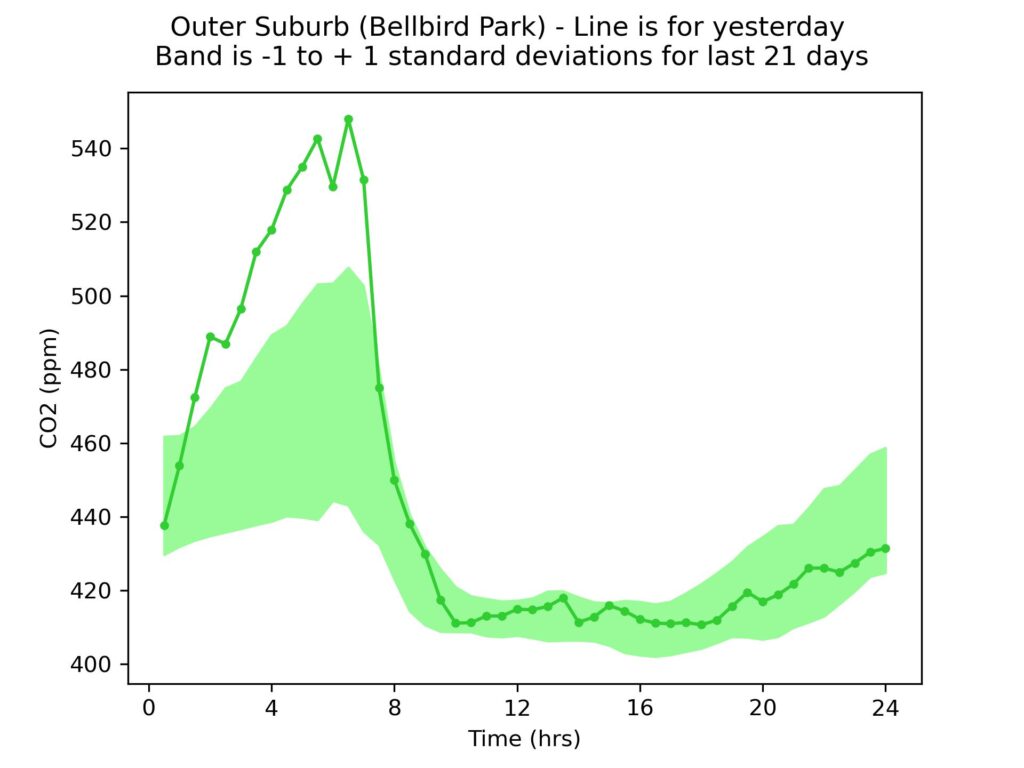
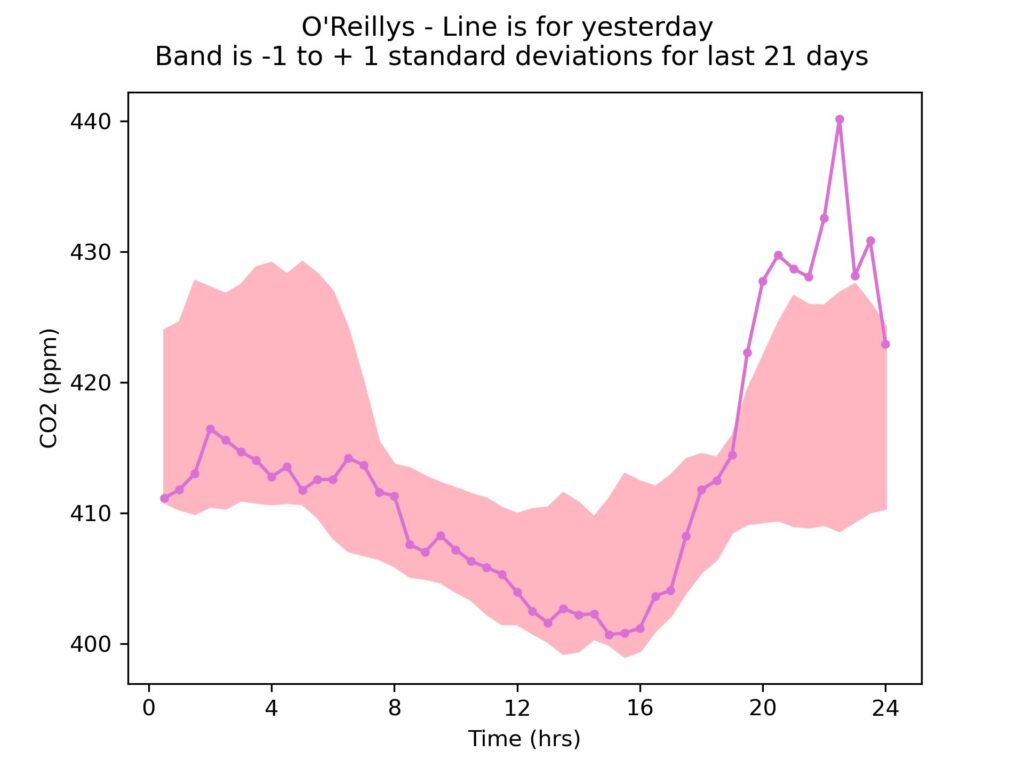
Not only is Petrie Terrace data again available, today we add data from a new site after some initial communication gremlins – O’Reillys Resort – a hilltop location in the Gold Coast hinterland. (Many thanks to Shane O’Reilly and his staff for hosting the site, and Justin Watson for making the contact). Astute observers will note that the low values at this site yesterday were 2 ppm lower than the southern hemisphere background level reported by CSIRO. We calibrated the equipment carefully and in situ to account for pressure differences at a higher elevation, so while it’s possible some of this low value could be attributed to measurement error with our simple equipment, such low values (about the same as background – or even slightly below – have been recorded at rural sites elsewhere, with photosynthesis and an absence of local anthropogenic sources playing a moderating role in CO2 concentrations. (See for example, Curcoll, Roger, Lluís Camarero, Montse Bacardit, Alba Àgueda, Claudia Grossi, Esperança Gacia, Anna Font, and Josepanton Morguí. ‘Atmospheric Carbon Dioxide Variability at Aigüestortes, Central Pyrenees, Spain’. Regional Environmental Change 19 (1 February 2019). https://doi.org/10.1007/s10113-018-1443-2. and Murayama, Shohei, Nobuko Saigusa, Douglas Chan, Susumu Yamamoto, Hiroaki Kondo, and Yozo Eguchi. ‘Temporal Variations of Atmospheric CO2 Concentration in a Temperate Deciduous Forest in Central Japan’. Tellus B: Chemical and Physical Meteorology 55, no. 2 (1 January 2003): 232–43. https://doi.org/10.3402/tellusb.v55i2.16751.) We have another rural location in the pipeline – such sites will help us put our urban data into better perspective. (Another interesting feature from yesterday was the sizeable overnight spike at Bellbird Park to a value about 60 ppm higher than our CBD site. No obvious explanation for this, but presumably it’s from a relatively localised source.
We’re growing the network – if you’d like to host or sponsor a sensor – leave us a message. As we add more sensor sites, comparisons across the urban area will become more robust and informative about Brisbane’s Carbon dioxide emissions.

Daily Averages
For reference, latest monthly average (Jan 2023) from CSIRO for Kennaook/Cape Grim in NW Tasmania was 415.0 ppm. (Note – these are provisional values, subject to revision folllowing sensor re-calibrations and other checks.)
| DATE | Petrie Terrace | Chapel Hill | Bellbird Park | O’Reillys |
| 14 Mar 2023 | 461 ppm | 443 ppm | 446 ppm | 413 ppm |
| 13 Mar 2023 | — | 447 ppm | 440 ppm | |
| 12 Mar 2023 | — | 452 ppm | 446 ppm | |
| 11 Mar 2023 | — | 447 ppm | 449 ppm | |
| 10 Mar 2023 | — | 443 ppm | 420 ppm | |
| 9 Mar 2023 | 470 ppm | 435 ppm | 436 ppm | |
| 8 Mar 2023 | 461 ppm | 427 ppm | 418 ppm | |
| 7 Mar 2023 | 452 ppm | 424 ppm | 427 ppm | |
| 6 Mar 2023 | 454 ppm | 428 ppm | 432 ppm | |
| 5 Mar 2023 | 450 ppm | 426 ppm | 430 ppm | |
| 4 Mar 2023 | 449 ppm | 425 ppm | 424 ppm | |
| 3 Mar 2023 | 456 ppm | 432 ppm | 427 ppm | |
| 2 Mar 2023 | 465 ppm | 434 ppm | 423 ppm | |
| 1 Mar 2023 | 452 ppm | 425ppm | 426 ppm | |
| 28 Feb 2023 | 453 ppm | 429 ppm | 429 ppm | |
| 27 Feb 2023 | 458 ppm | 432 ppm | 437 ppm | |
| 26 Feb 2023 | 455 ppm | 434 ppm | 440 ppm | |
| 25 Feb 2023 | 454 ppm | 432 ppm | 435 ppm | |
| 24 Feb 2023 | 452 ppm | 428 ppm | 423 ppm | |
| 23 Feb 2023 | 454 ppm | 428 ppm | 421 ppm | |
| 22 Feb 2023 | 457 ppm | 433 ppm | 425 ppm | |
| 21 Feb 2023 | 463 ppm | 437ppm | 429 ppm | |
| 20 Feb 2023 | 460 ppm | 438 ppm | 425 ppm | |
| 19 Feb 2023 | 459 ppm | 434 ppm | 430 ppm | |
| 18 Feb 2023 | 463 ppm | 436 ppm | 438 ppm | |
| 17 Feb 2023 | 466 ppm | 437 ppm | 443 ppm | |
| 16 Feb 2023 | 459 ppm | 435 ppm | 438 ppm | |
| 15 Feb 2023 | 459 ppm | 430 ppm | 426 ppm | |
| 14 Feb 2023 | 457 ppm | 431 ppm | 419 ppm | |
| 13 Feb 2023 | 453 ppm | 429 ppm | 418 ppm | |
| 12 Feb 2023 | 450 ppm | 428 ppm | 436 ppm | |
| 11 Feb 2023 | 448 ppm | 428 ppm | 435 ppm | |
| 10 Feb 2023 | 451 ppm | 429ppm | 418 ppm | |
| 9 Feb 2023 | 451 ppm | 428ppm | 413 ppm | |
| 8 Feb 2023 | 452 ppm | 429 ppm | 416 ppm | |
| 7 Feb 2023 | 454 ppm | 434 ppm | 434 ppm | |
| 6 Feb 2023 | 454 ppm | 436 ppm | 425 ppm | |
| 5 Feb 2023 | 454 ppm | 447 ppm | 433 ppm | |
| 4 Feb 2023 | 456 ppm | 451 ppm | 451 ppm | |
| 3 Feb 2023 | 464 ppm | 438 ppm | 442 ppm | |
| 2 Feb 2023 | 451 ppm | 426 ppm | 418 ppm | |
| 1 Feb 2023 | 460 ppm | — | 428 ppm | |
| 31 Jan 2023 | 459 ppm | — | 434 ppm | |
| 30 Jan 2023 | 454 ppm | 432 ppm | 432 ppm | |
| 29 Jan 2023 | 455 ppm | 437 ppm | 450 ppm | |
| 28 Jan 2023 | 470 ppm | 451 ppm | 449 ppm | |
| 27 Jan 2023 | 469 ppm | 452 ppm | 445 ppm | |
| 26 Jan 2023 | 470 ppm | 451 ppm | 449 ppm | |
| 25 Jan 2023 | 470 ppm | 440 ppm | 436 ppm | |
| 24 Jan 2023 | 460 ppm | 436 ppm | 433 ppm | |
| 23 Jan 2023 | 455 ppm | 435 ppm | 441 ppm | |
| 22 Jan 2023 | 448 ppm | 433 ppm | 433 ppm | |
| Week Three 2023 (average +/- SD) | 453 +/- 4 ppm | 434 +/- 4 ppm | 426 +/- 6 ppm | |
| 21 Jan 2023 | 450 ppm | 431 ppm | 425 ppm | |
| 20 Jan 2023 | 453 ppm | 431 ppm | 421 ppm | |
| 19 Jan 2023 | 451 ppm | 430 ppm | 436 ppm | |
| 18 Jan 2023 | 451 ppm | 431 ppm | 421 ppm | |
| 17 Jan 2023 | 453 ppm | 436 ppm | 422 ppm | |
| 16 Jan 2023 | 460 ppm | 440 ppm | 425 ppm | |
| 15 Jan 2023 | 456 ppm | 436 ppm | 432 ppm | |
| Week Two 2023 (average +/- SD) | 450 +/- 3 ppm | 432 +/- 3 ppm | 420 +/- 8 ppm | |
| 14 Jan 2023 | 452 ppm | 431 ppm | 422 ppm | |
| 13 Jan 2023 | 455 ppm | 433ppm | 422 ppm | |
| 12 Jan 2023 | 452 ppm | 433 ppm | 433 ppm | |
| 11 Jan 2023 | 453 ppm | 433 ppm | 442 ppm | |
| 10 Jan 2023 | 453 ppm | 435 ppm | 424 ppm | |
| 9 Jan 2023 | 447 ppm | 427 ppm | 426 ppm | |
| 8 Jan 2023 | 450 ppm | 434 ppm | 439 ppm | |
| Week One 2023 (average +/- SD) | 453 +/- 7 ppm | 435 +/- 4 ppm | 432 +/- 8 ppm | |
| 7 Jan 2023 | 449 ppm | 436 ppm | 439 ppm | |
| 6 Jan 2023 | 450 ppm | 435 ppm | 429 ppm | |
| 5 Jan 2023 | 468 ppm | 443 ppm | 437 ppm | |
| 4 Jan 2023 | 454 ppm | 431 ppm | 440 ppm | |
| 3 Jan 2023 | 450 ppm | 436 ppm | 436 ppm | |
| 2 Jan 2023 | 448 ppm | 431 ppm | 423 ppm | |
| 1 Jan 2023 | 451 ppm | 436 ppm | 422 ppm |