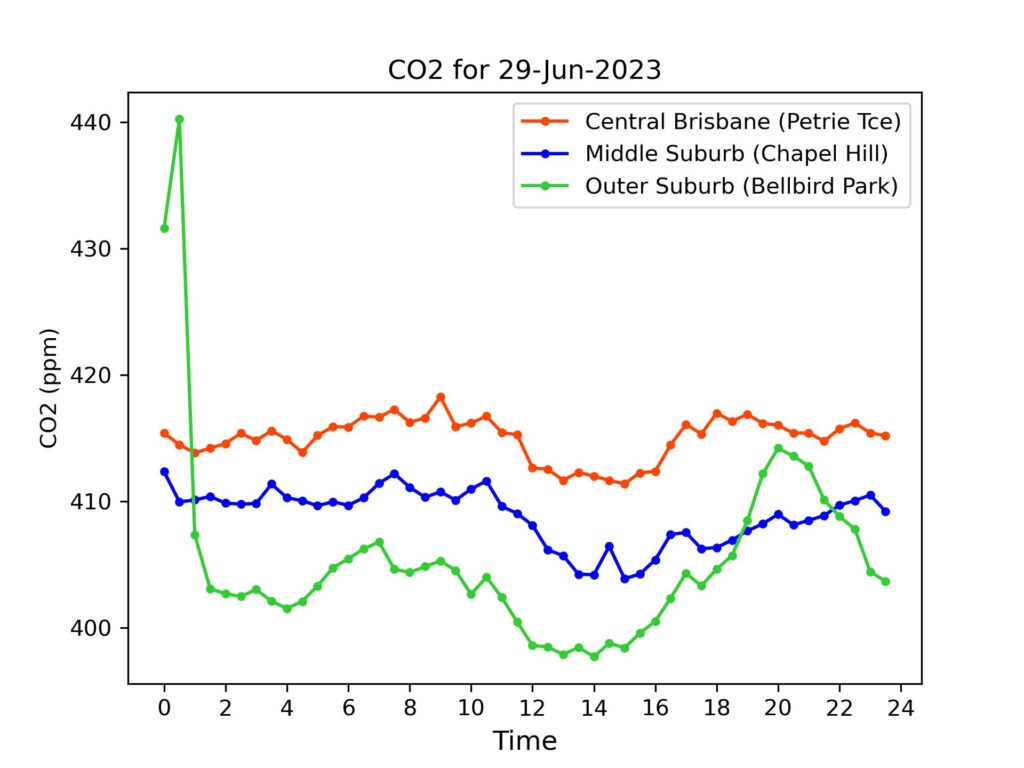
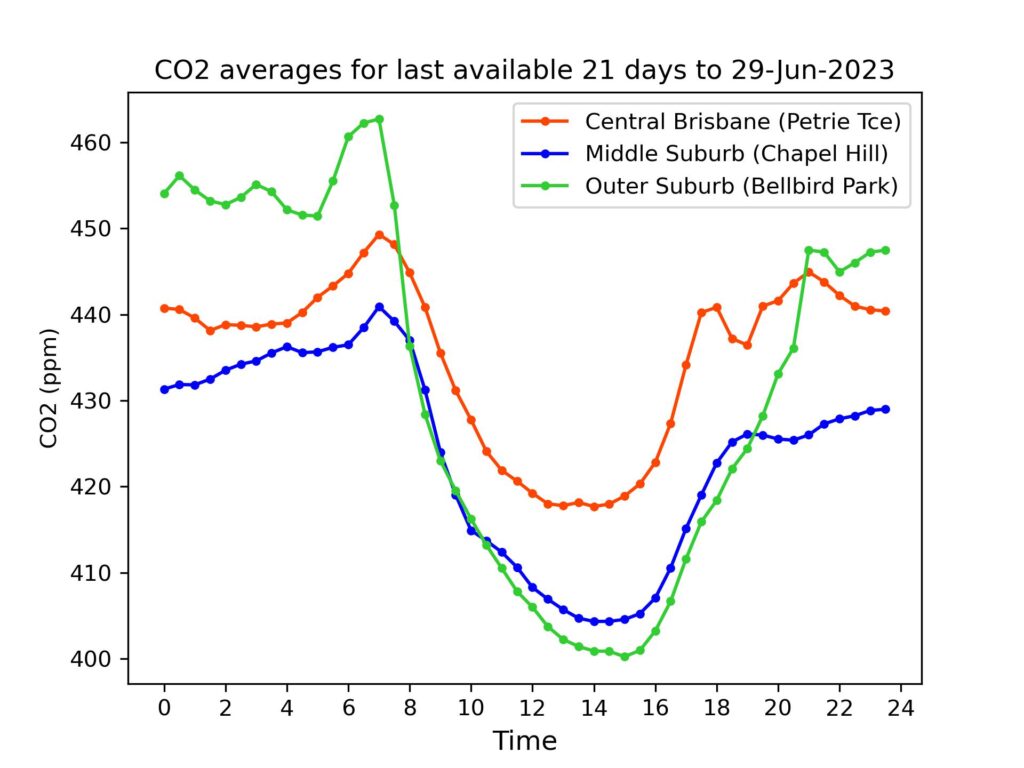
Brisbane CO2 for 29 June 2023
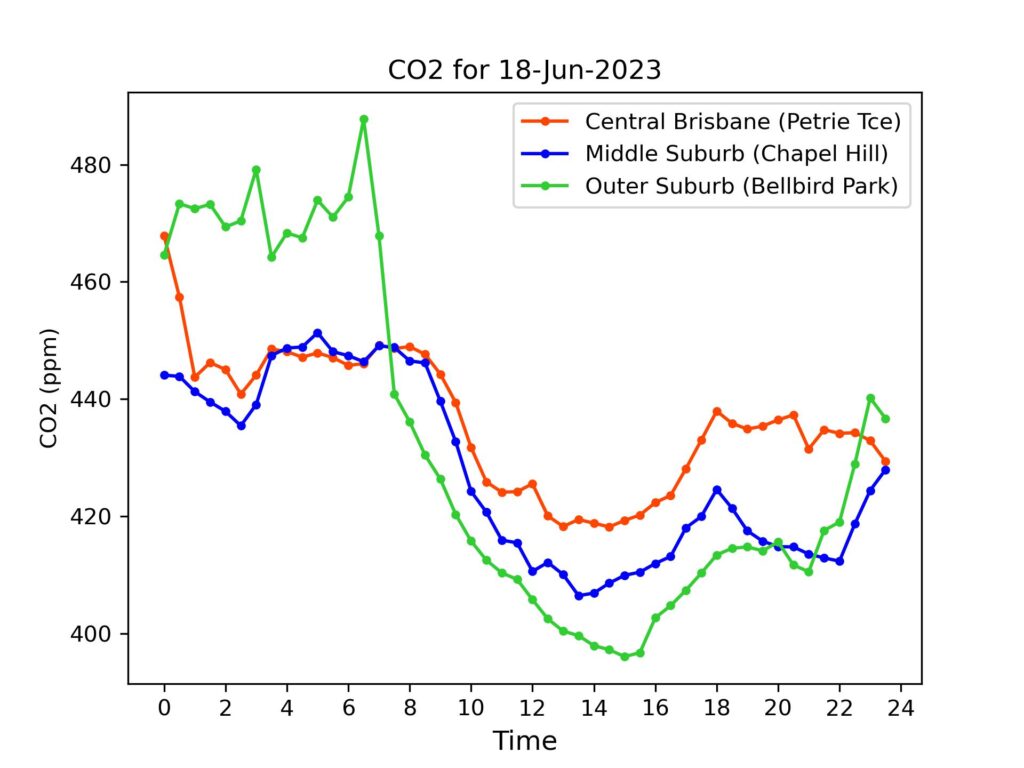
Thursday saw both unusually low carbon dioxide concentrations and a relatively flat pattern across the 24 hours. The most likely explanation is the same as for 26 Jun – stronger than normal winds (20 km/h at 9 a.m. and 26 km/h at 3 p.m. recorded at Archerfield, and both, unusually, from due west). This would tend to bring in air from outside the urban area, and less influenced by anthropogenic sources. Future analysis will look more closely at wind direction effects as they could throw some light on urban carbon dioxide concentrations.
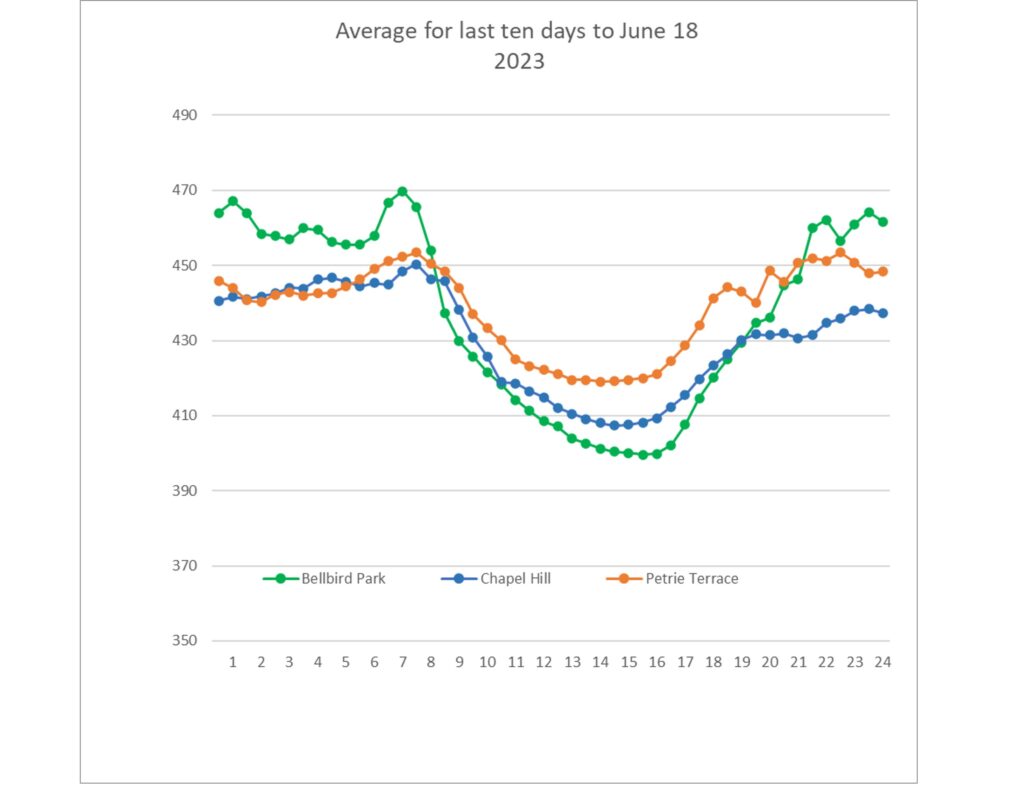
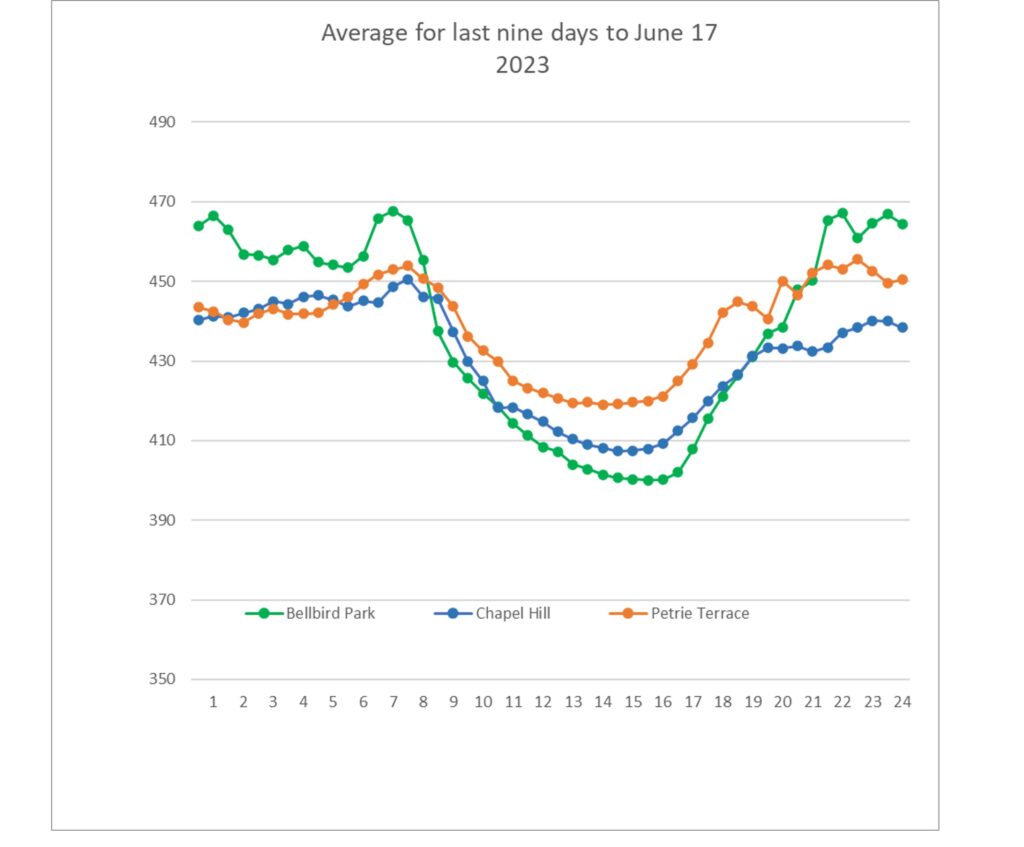
Daily Averages – Phase 2 (See explanation of differences between Phase 1 and Phase 2 data)
For reference, latest monthly average (May 2023) from CSIRO for Kennaook/Cape Grim in NW Tasmania was 415.7 ppm. (Note – these are provisional values, subject to revision folllowing sensor re-calibrations and other checks.)
| Date | Petrie Terrace | Chapel Hill | Bellbird Park |
| 29-Jun-2023 | 415 ppm | 409 ppm | 405 ppm |
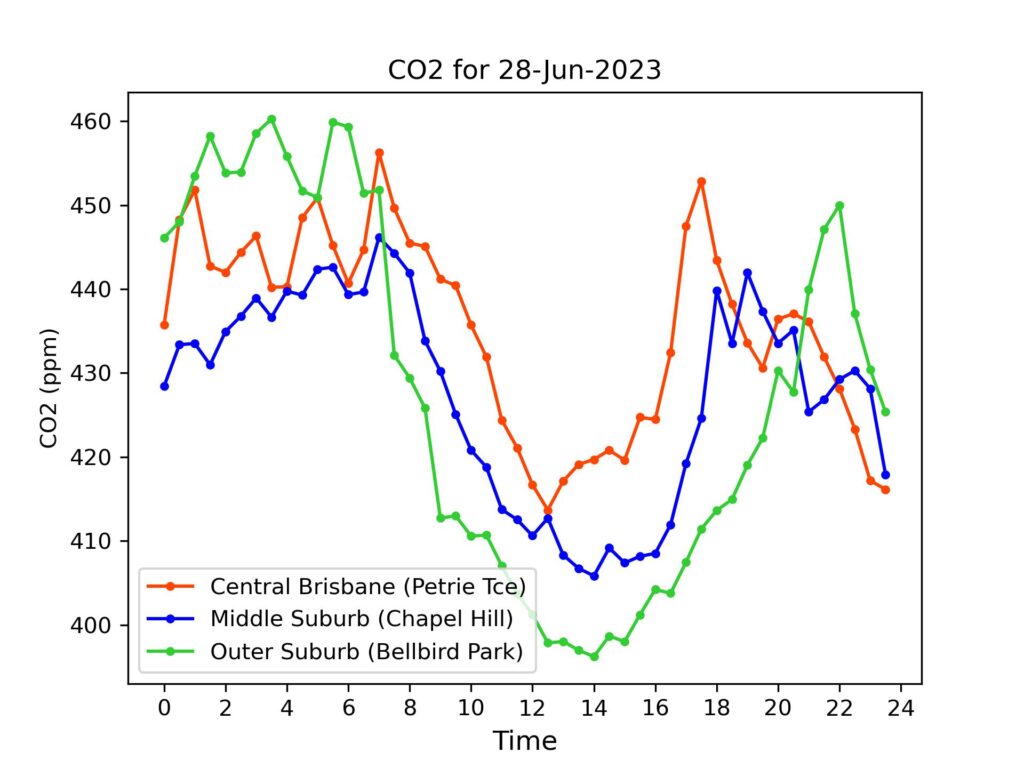
| 28-Jun-2023 | 435 ppm | 427 ppm | 428 ppm |
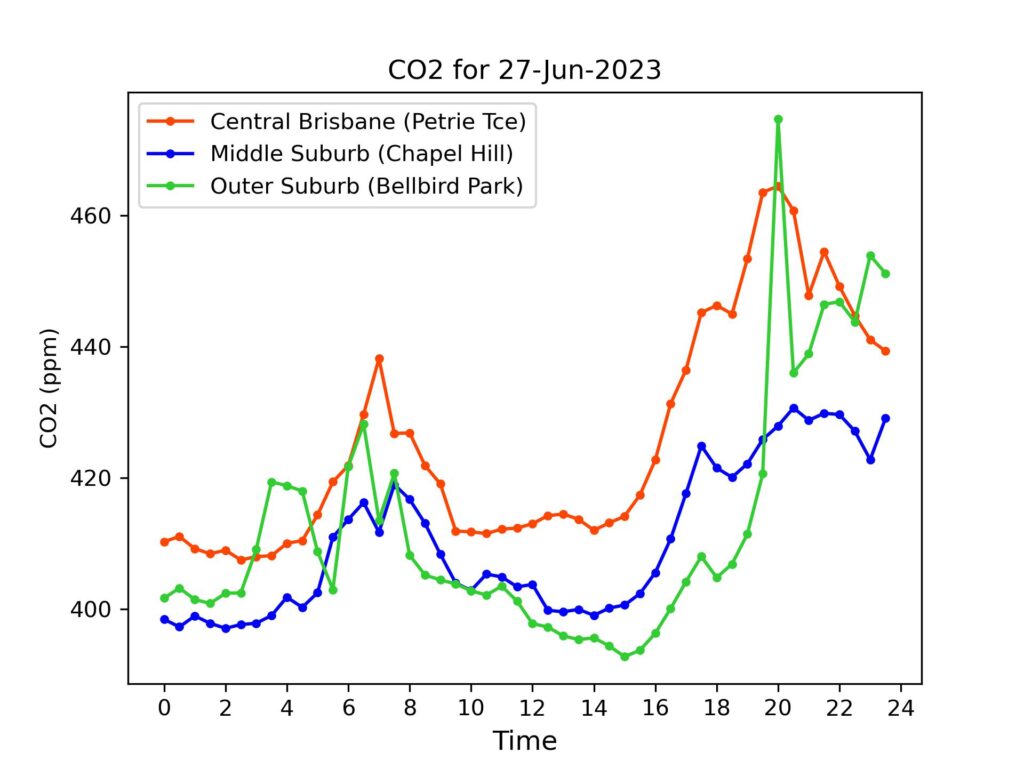
| 27-Jun-2023 | 426 ppm | 409 ppm | 415 ppm |
| 26-Jun-2023 | 412 ppm | 402 ppm | 412 ppm |
| 25-Jun-2023 | 447 ppm | 426 ppm | 429 ppm |
| 24-Jun-2023 | 427 ppm | 417 ppm | 423 ppm |
| 23-Jun-2023 | 434 ppm | 427 ppm | 435 ppm |
| 22-Jun-2023 | 442 ppm | 425 ppm | 436 ppm |
| 21-Jun-2023 | 443 ppm | 421 ppm | 437 ppm |
| 20-Jun-2023 | 421 ppm | 414 ppm | 417 ppm |
| 19-Jun-2023 | 430 ppm | 418 ppm | 419 ppm |
| 18-Jun-2023 | 436 ppm | 426 ppm | 434 ppm |
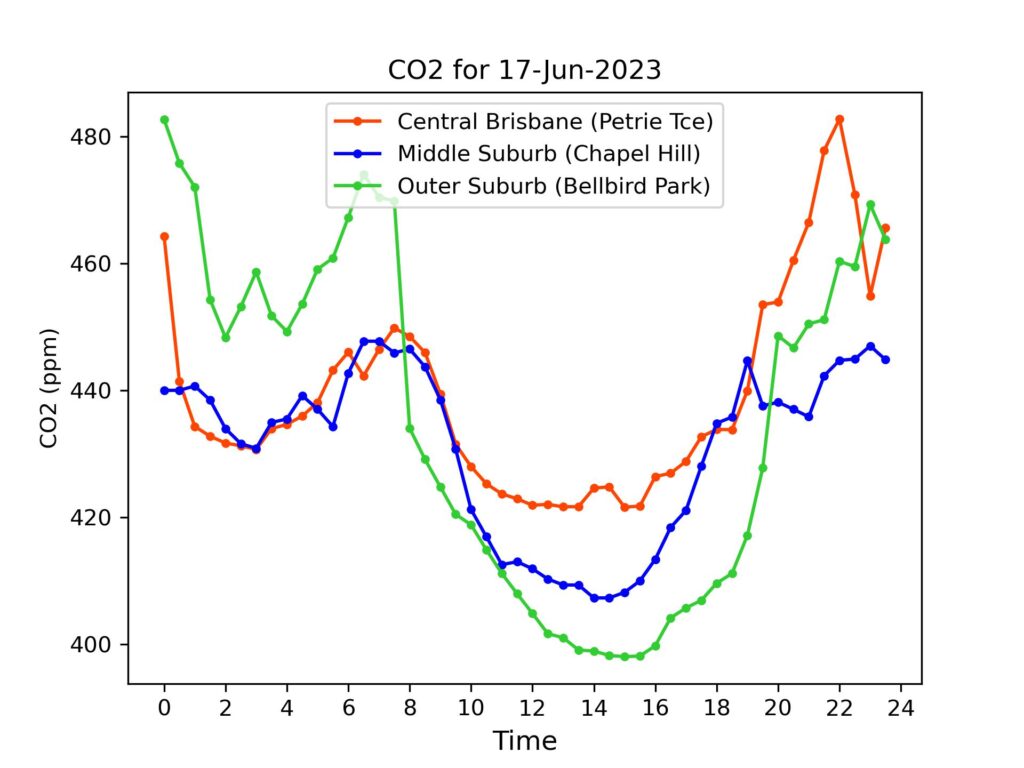
| 17-Jun-2023 | 440 ppm | 429 ppm | 437 ppm |
| 16-Jun-2023 | 438 ppm | 421 ppm | 433 ppm |
| 15-Jun-2023 | 433 ppm | 412 ppm | 428 ppm |
| 14-Jun-2023 | 435 ppm | 425 ppm | 438 ppm |
| 13-Jun-2023 | 441 ppm | 436 ppm | 442 ppm |
| 12-Jun-2023 | 442 ppm | 439 ppm | 448ppm |
| 11-Jun-2023 | 443 ppm | 441 ppm | 451 ppm |
| 10-Jun-2023 | 446 ppm | 432 ppm | 4444 ppm |
| 9-Jun-2023 | 441 ppm | 428 ppm | 440ppm |
Brisbane CO2 for 29 June 2023 Read More »