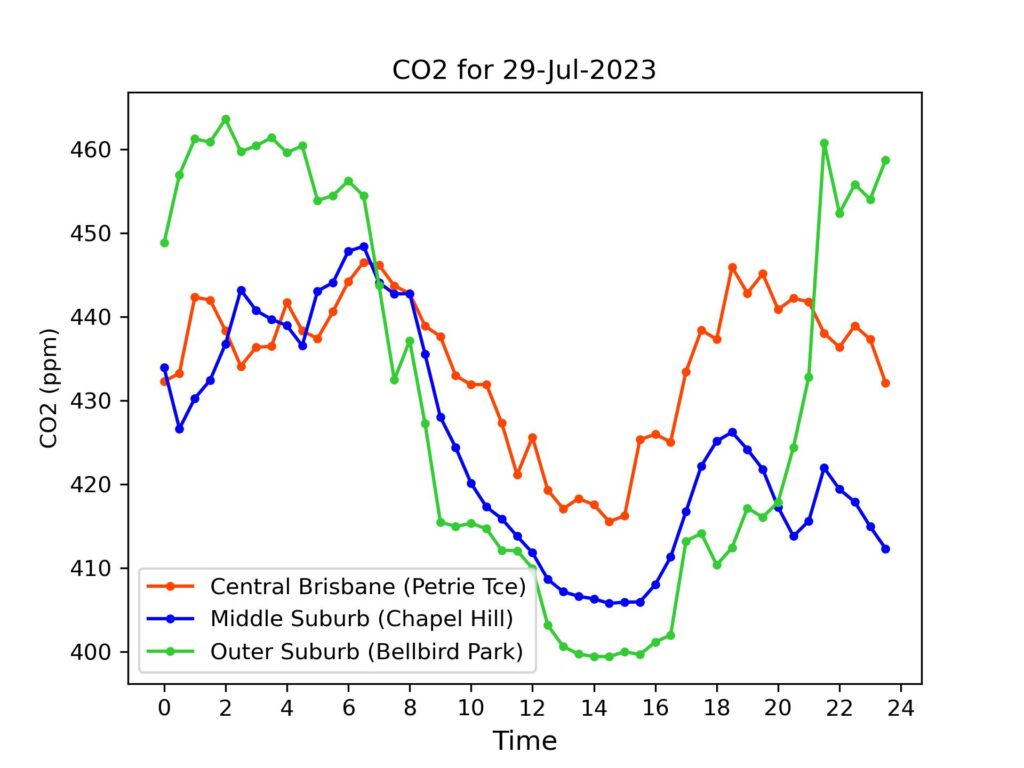
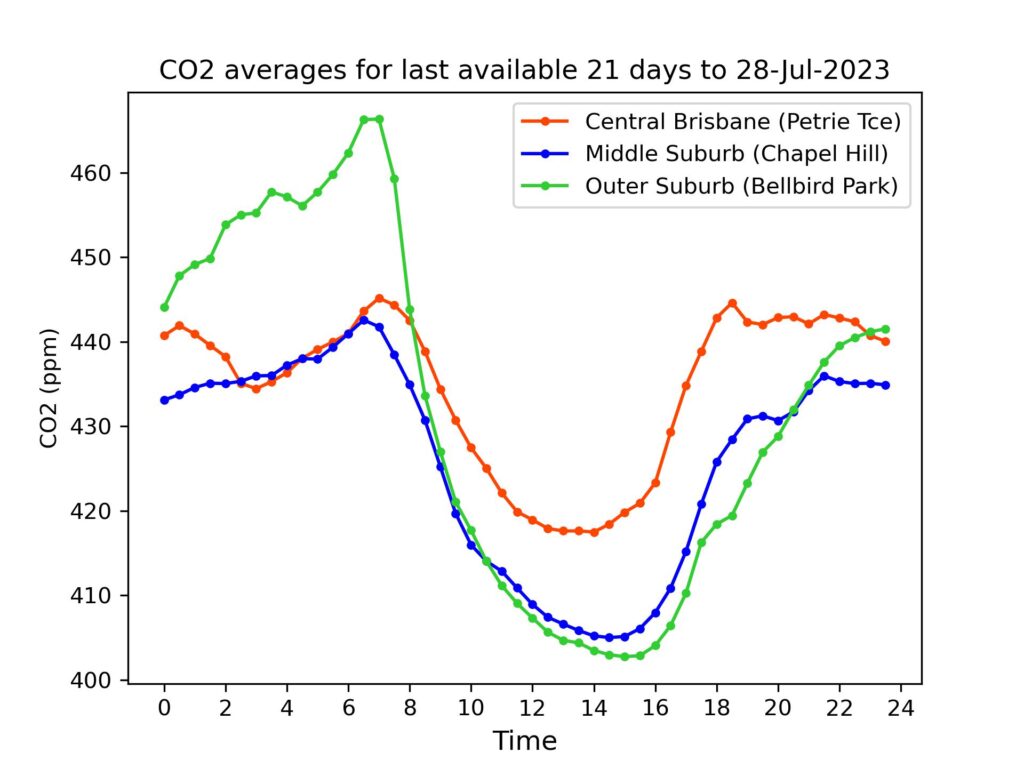
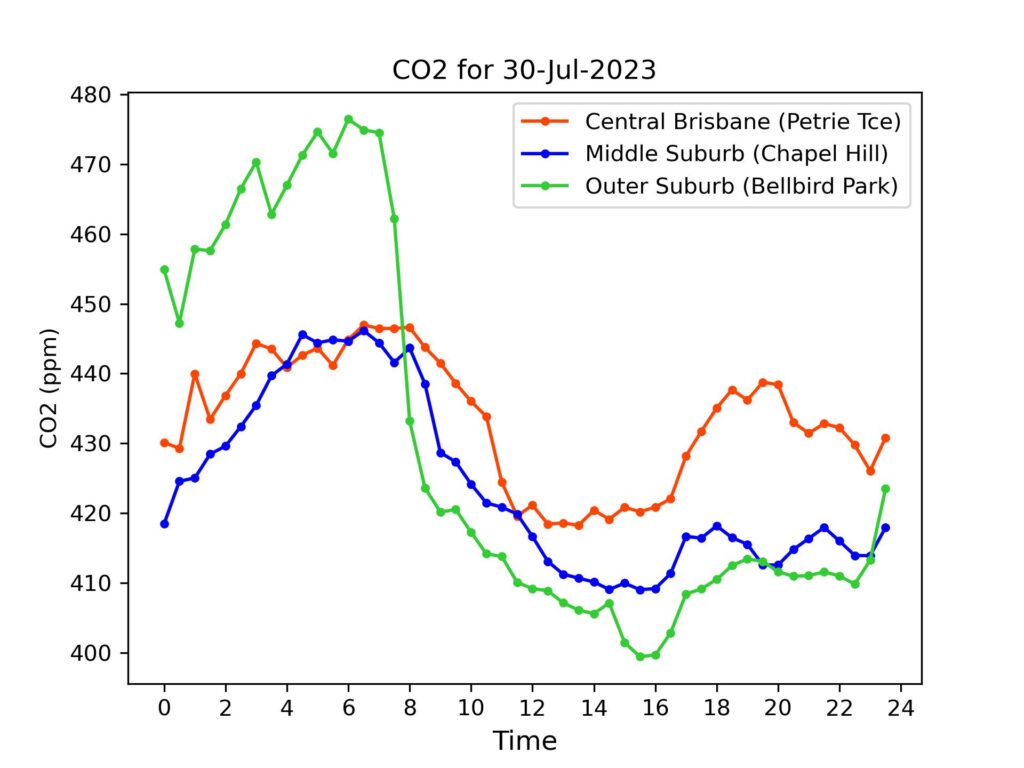
Brisbane CO2 for 30 July 2023
The three Brisbane sites’ daily averages changed only marginally on Sunday, with an overall average of 429 ppm for the day. Values fell substantially across the course of the day at Bellbird Park.
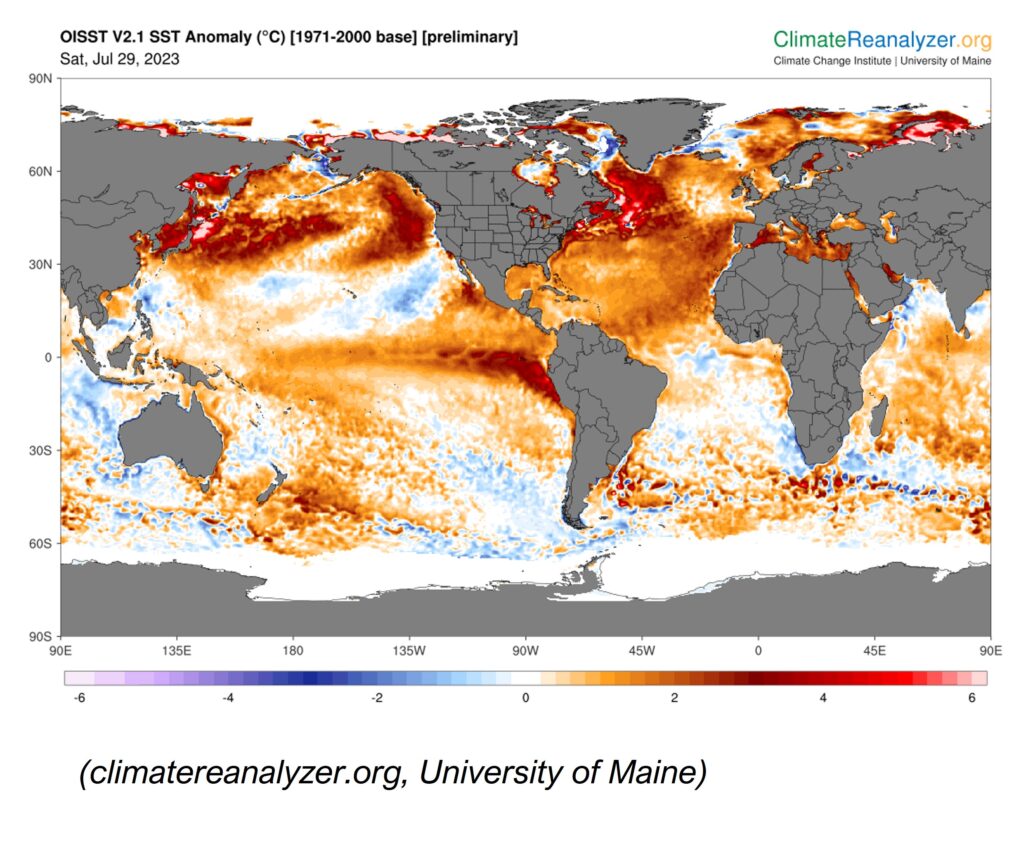
The latest estimate of global average temperature reported in the NCEP Climate Forecast System (CFS) version 2 data-set now stretches to 27 consecutive days (up to Saturday) above the temperature for any previous day in its 45 year record, and some scientists believe these are likely to be the highest global temperatures for about 120,000 years.
Today’s final figure shows sea surface temperature anomalies from the NOAA Optimum Interpolation SST (OISST) version 2.1. The colours indicate differences from the 1971-2000 baseline. The exceptionally warm areas across the Northern Hemisphere and the build-up of warm water in the Eastern Pacific are very clear. Overall, sea surface temperature has been higher than any value in the data-set for each date for over four months. As of Saturday the world’s sea surface temperature was 4 standard deviations above the mean for that date.
Daily Averages – Phase 2 (See explanation of differences between Phase 1 and Phase 2 data)
For reference, latest monthly average (June 2023) from CSIRO for Kennaook/Cape Grim in NW Tasmania was 416.1 ppm. (Note – these are provisional values, subject to revision folllowing sensor re-calibrations and other checks.)
| Date | Petrie Terrace | Chapel Hill | Bellbird Park |
| 30-Jul-2023 | 433 ppm | 424 ppm | 430 ppm |
| 29-Jul-2023 | 434 ppm | 424 ppm | 431 ppm |
| 28-Jul-2023 | 431 ppm | 424 ppm | 426 ppm |
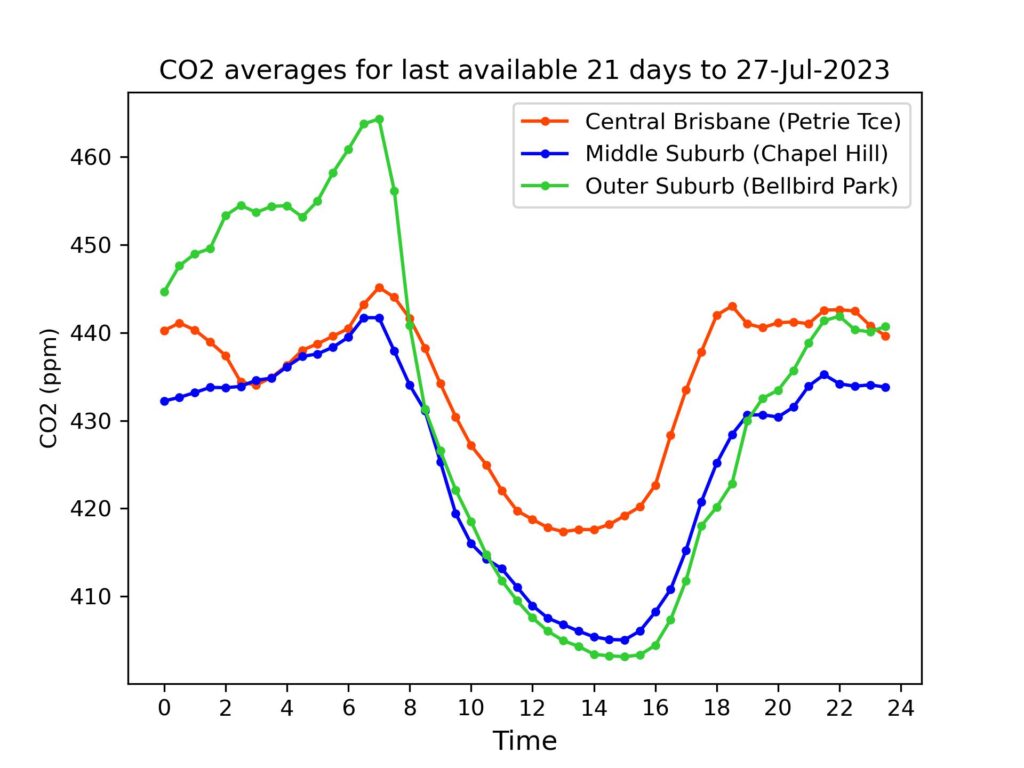
| 27-Jul-2023 | 429 ppm | 430 ppm | 433 ppm |
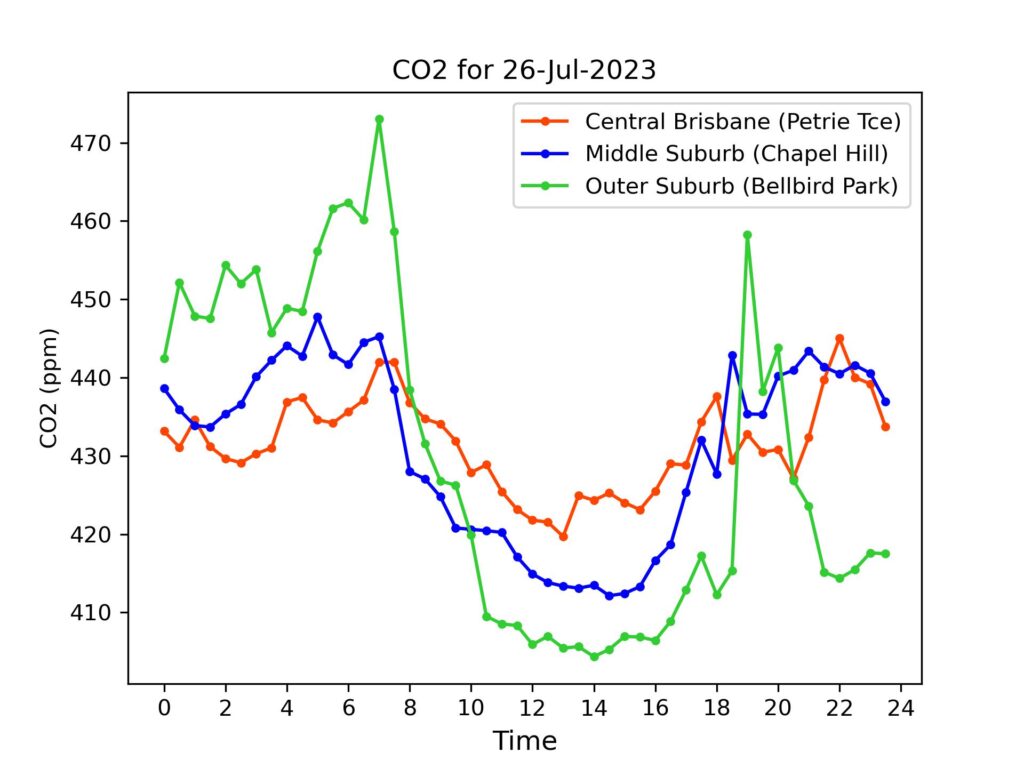
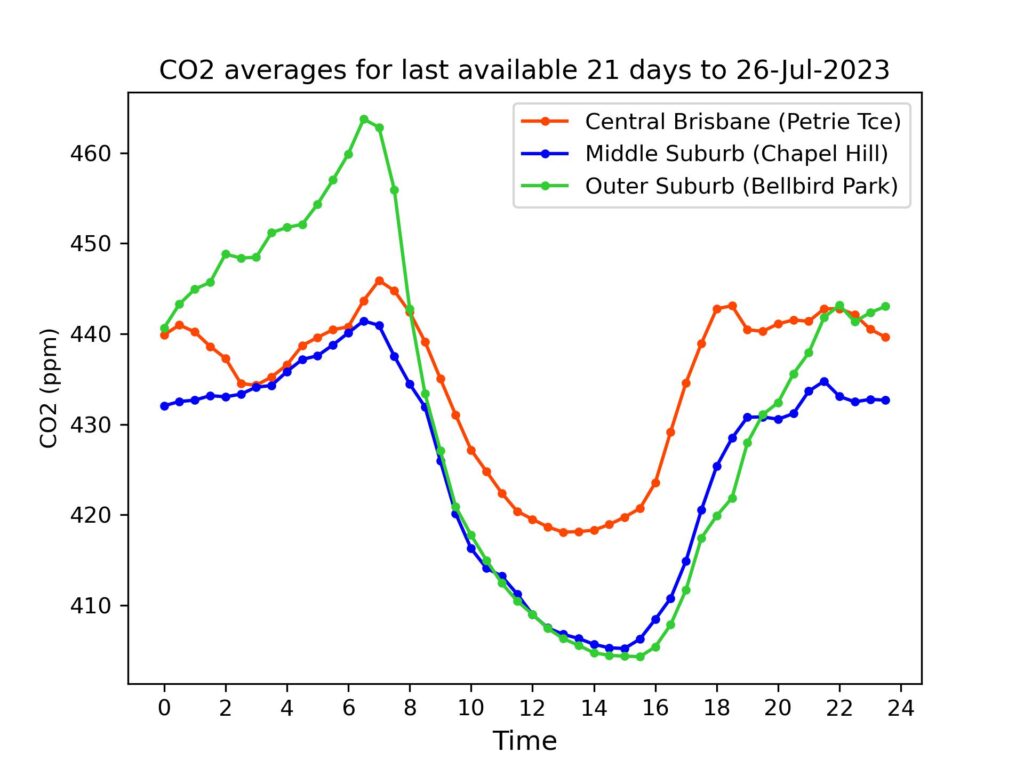
| 26-Jul-2023 | 432 ppm | 431 ppm | 430 ppm |
| 25-Jul-2023 | 427 ppm | 425 ppm | 424 ppm |
| 24-Jul-2023 | 420 ppm | 418 ppm | 418 ppm |
| 23-Jul-2023 | 424 ppm | 421 ppm | 420 ppm |
| 22-Jul-2023 | 434 ppm | 429 ppm | 428 ppm |
| 21-Jul-2023 | 446 ppm | 430 ppm | — |
| 20-Jul-2023 | 433 ppm | 430 ppm | — |
| 19-Jul-2023 | 437 ppm | 436 ppm | 439 ppm |
| 18-Jul-2023 | 443 ppm | 432ppm | 433 ppm |
| 17-Jul-2023 | 435 ppm | 432 ppm | 436 ppm |
| 16-Jul-2023 | 436 ppm | 432 ppm | 441 ppm |
| 15-Jul-2023 | 449 ppm | 434 ppm | 452 ppm |
| 14-Jul-2023 | 452 ppm | 435 ppm | 448 ppm |
| 13-Jul-2023 | 433 ppm | 431 ppm | 429 ppm |
| 12-Jul-2023 | 437 ppm | 437 ppm | 438 ppm |
| 11-Jul-2023 | 448 ppm | 434 ppm | 438 ppm |
| 10-Jul-2023 | 439 ppm | 424 ppm | 432 ppm |
| 9-Jul-2023 | 423 ppm | 411 ppm | 417 ppm |
| 8-Jul-2023 | 418 ppm | 411 ppm | 414 ppm |
| 7-Jul-2023 | 413 ppm | 407 ppm | 408 ppm |
| 6-Jul-2023 | 434 ppm | 427 ppm | 428 ppm |
| 5-Jul-2023 | 442 ppm | 441 ppm | 429 ppm |
| 4-Jul-2023 | 449 ppm | 443 ppm | 429 ppm |
| 3-Jul-2023 | 428 ppm | 429 ppm | 412 ppm |
| 2-Jul-2023 | 424 ppm | 425 ppm | 414 ppm |
| 1-Jul-2023 | 419 ppm | 407 ppm | 405 ppm |
| 30-Jun-2023 | 414 ppm | 405 ppm | 402 ppm |
| 29-Jun-2023 | 415 ppm | 409 ppm | 405 ppm |
| 28-Jun-2023 | 435 ppm | 427 ppm | 428 ppm |
| 27-Jun-2023 | 426 ppm | 409 ppm | 415 ppm |
| 26-Jun-2023 | 412 ppm | 402 ppm | 412 ppm |
| 25-Jun-2023 | 447 ppm | 426 ppm | 429 ppm |
| 24-Jun-2023 | 427 ppm | 417 ppm | 423 ppm |
| 23-Jun-2023 | 434 ppm | 427 ppm | 435 ppm |
| 22-Jun-2023 | 442 ppm | 425 ppm | 436 ppm |
| 21-Jun-2023 | 443 ppm | 421 ppm | 437 ppm |
| 20-Jun-2023 | 421 ppm | 414 ppm | 417 ppm |
| 19-Jun-2023 | 430 ppm | 418 ppm | 419 ppm |
| 18-Jun-2023 | 436 ppm | 426 ppm | 434 ppm |
| 17-Jun-2023 | 440 ppm | 429 ppm | 437 ppm |
| 16-Jun-2023 | 438 ppm | 421 ppm | 433 ppm |
| 15-Jun-2023 | 433 ppm | 412 ppm | 428 ppm |
| 14-Jun-2023 | 435 ppm | 425 ppm | 438 ppm |
| 13-Jun-2023 | 441 ppm | 436 ppm | 442 ppm |
| 12-Jun-2023 | 442 ppm | 439 ppm | 448ppm |
| 11-Jun-2023 | 443 ppm | 441 ppm | 451 ppm |
| 10-Jun-2023 | 446 ppm | 432 ppm | 444 ppm |
| 9-Jun-2023 | 441 ppm | 428 ppm | 440ppm |
Brisbane CO2 for 30 July 2023 Read More »