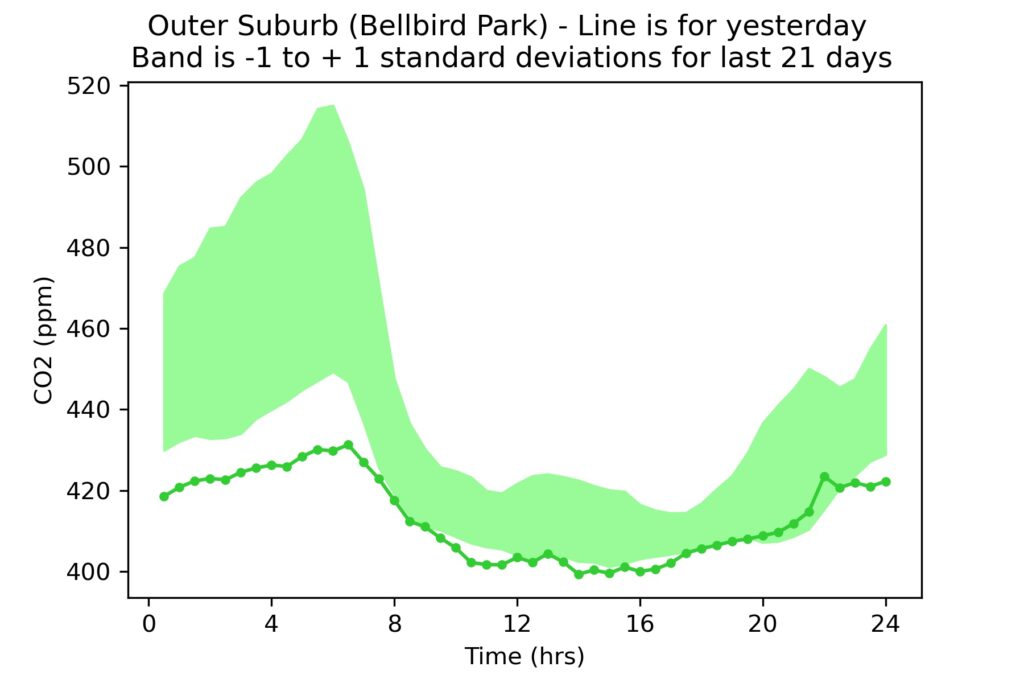
Thursday saw the lowest average (431 ppm) across the three sites so far this year, although only the Bellbird Park site had its individual low. Note that the average of 413 ppm at Bellbird Park is lower than the most recent Kennaook/Cape Grim monthly average of just over 415 ppm. An individual location at the surface can have periods with values lower than “well-mixed” air if the balance of photosynthesis and emissions is favourable, even if urban sites generally have higher values than the background level. We’re growing the network – if you’d like to host or sponsor a sensor – leave us a message. As we add more sensor sites, comparisons across the urban area will become more robust and informative about Brisbane’s Carbon dioxide emissions.
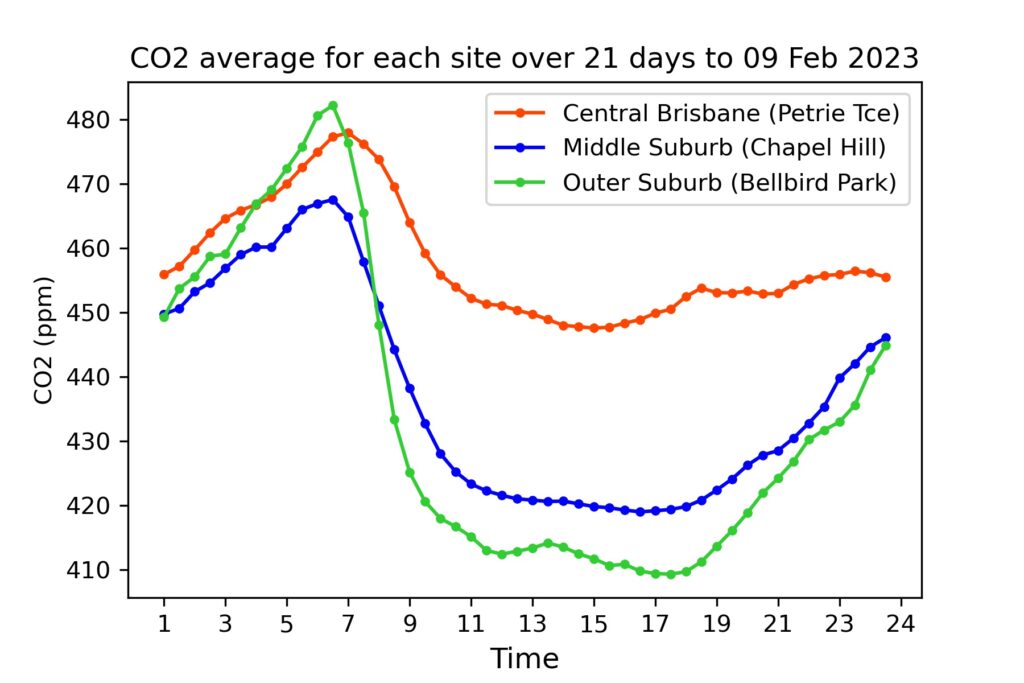
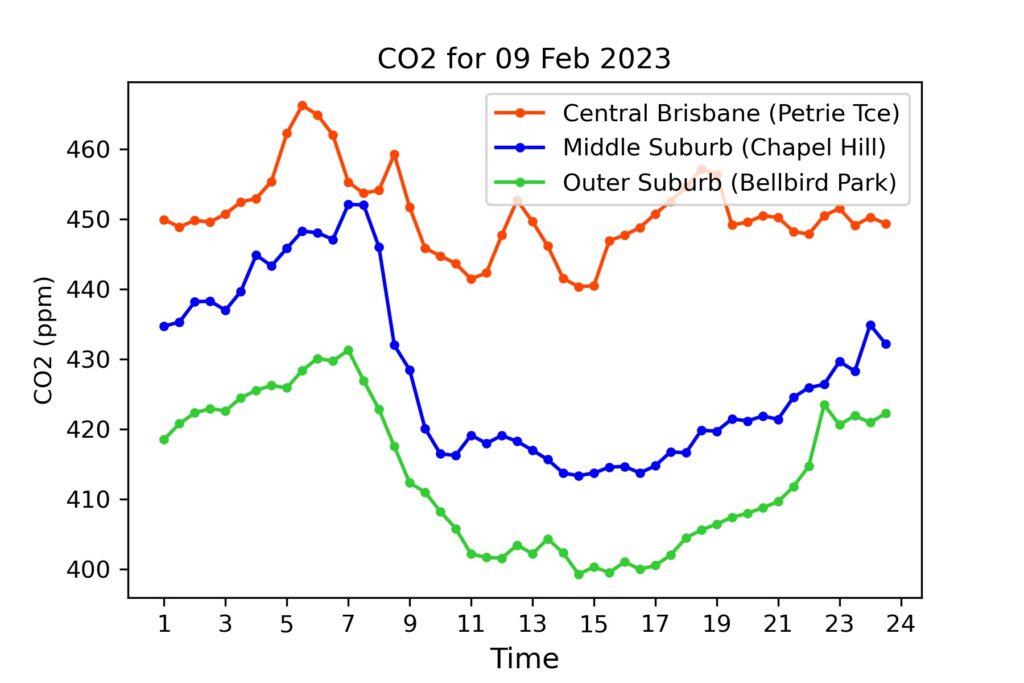
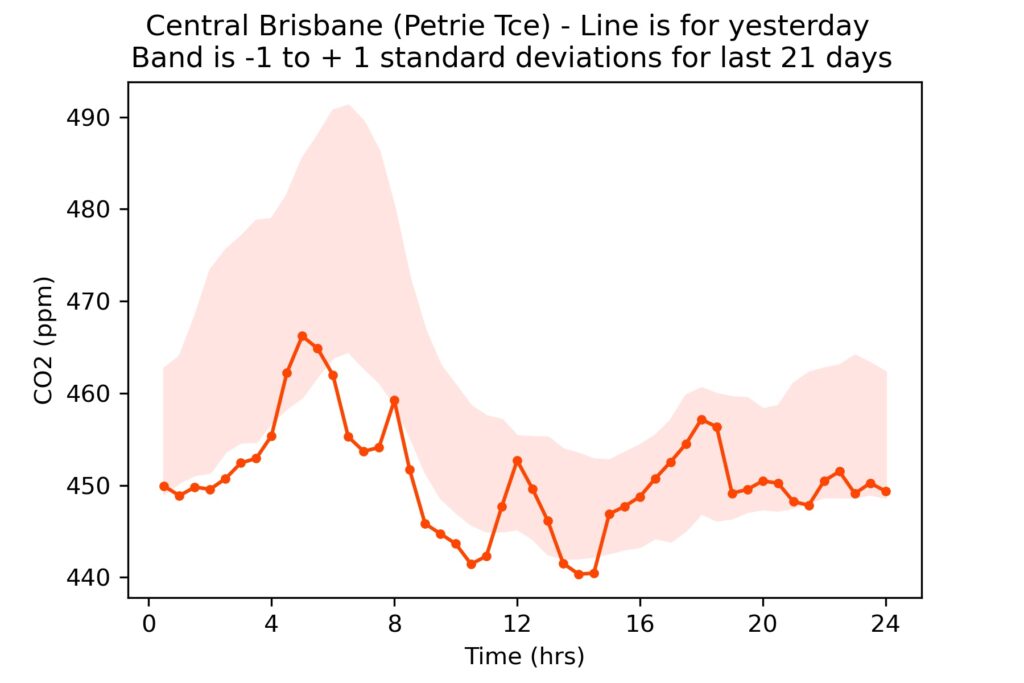
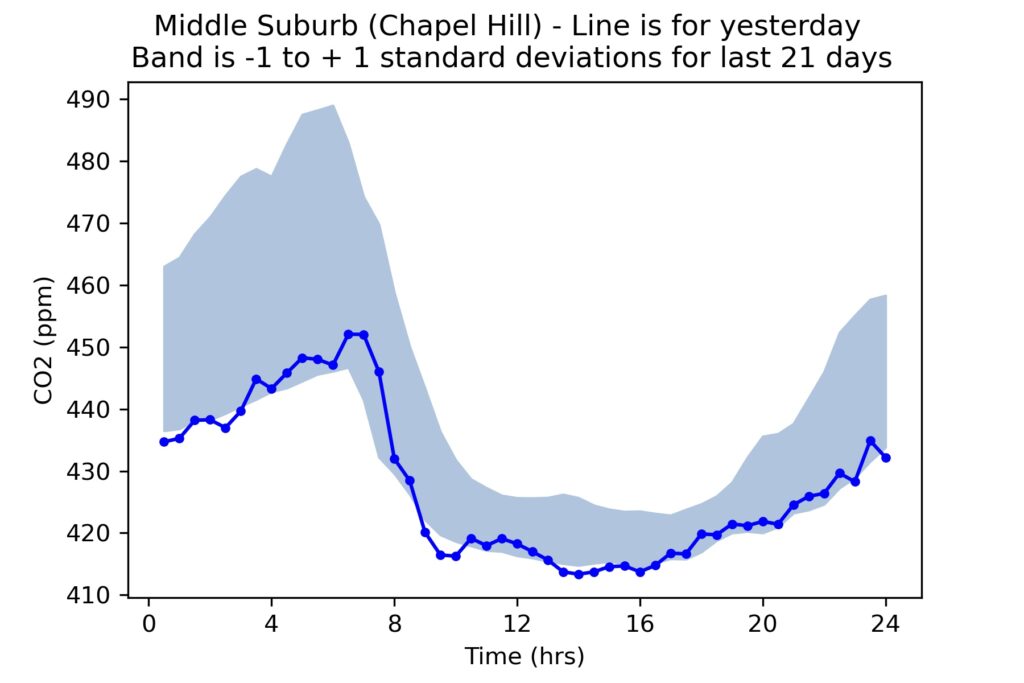
Daily Averages
For reference, latest monthly average (Dec 2022) from CSIRO for Kennaook/Cape Grim in NW Tasmania was 415.2 ppm. (Note – these are provisional values, subject to revision folllowing sensor re-calibrations and other checks.)
| DATE | Petrie Terrace | Chapel Hill | Bellbird Park |
| 9 Feb 2023 | 451 ppm | 428ppm | 413 ppm |
| 8 Feb 2023 | 452 ppm | 429 ppm | 416 ppm |
| 7 Feb 2023 | 454 ppm | 434 ppm | 434 ppm |
| 6 Feb 2023 | 454 ppm | 436 ppm | 425 ppm |
| 5 Feb 2023 | 454 ppm | 447 ppm | 433 ppm |
| 4 Feb 2023 | 456 ppm | 451 ppm | 451 ppm |
| 3 Feb 2023 | 464 ppm | 438 ppm | 442 ppm |
| 2 Feb 2023 | 451 ppm | 426 ppm | 418 ppm |
| 1 Feb 2023 | 460 ppm | — | 428 ppm |
| 31 Jan 2023 | 459 ppm | — | 434 ppm |
| 30 Jan 2023 | 454 ppm | 432 ppm | 432 ppm |
| 29 Jan 2023 | 455 ppm | 437 ppm | 450 ppm |
| 28 Jan 2023 | 470 ppm | 451 ppm | 449 ppm |
| 27 Jan 2023 | 469 ppm | 452 ppm | 445 ppm |
| 26 Jan 2023 | 470 ppm | 451 ppm | 449 ppm |
| 25 Jan 2023 | 470 ppm | 440 ppm | 436 ppm |
| 24 Jan 2023 | 460 ppm | 436 ppm | 433 ppm |
| 23 Jan 2023 | 455 ppm | 435 ppm | 441 ppm |
| 22 Jan 2023 | 448 ppm | 433 ppm | 433 ppm |
| Week Three 2023 (average +/- SD) | 453 +/- 4 ppm | 434 +/- 4 ppm | 426 +/- 6 ppm |
| 21 Jan 2023 | 450 ppm | 431 ppm | 425 ppm |
| 20 Jan 2023 | 453 ppm | 431 ppm | 421 ppm |
| 19 Jan 2023 | 451 ppm | 430 ppm | 436 ppm |
| 18 Jan 2023 | 451 ppm | 431 ppm | 421 ppm |
| 17 Jan 2023 | 453 ppm | 436 ppm | 422 ppm |
| 16 Jan 2023 | 460 ppm | 440 ppm | 425 ppm |
| 15 Jan 2023 | 456 ppm | 436 ppm | 432 ppm |
| Week Two 2023 (average +/- SD) | 450 +/- 3 ppm | 432 +/- 3 ppm | 420 +/- 8 ppm |
| 14 Jan 2023 | 452 ppm | 431 ppm | 422 ppm |
| 13 Jan 2023 | 455 ppm | 433ppm | 422 ppm |
| 12 Jan 2023 | 452 ppm | 433 ppm | 433 ppm |
| 11 Jan 2023 | 453 ppm | 433 ppm | 442 ppm |
| 10 Jan 2023 | 453 ppm | 435 ppm | 424 ppm |
| 9 Jan 2023 | 447 ppm | 427 ppm | 426 ppm |
| 8 Jan 2023 | 450 ppm | 434 ppm | 439 ppm |
| Week One 2023 (average +/- SD) | 453 +/- 7 ppm | 435 +/- 4 ppm | 432 +/- 8 ppm |
| 7 Jan 2023 | 449 ppm | 436 ppm | 439 ppm |
| 6 Jan 2023 | 450 ppm | 435 ppm | 429 ppm |
| 5 Jan 2023 | 468 ppm | 443 ppm | 437 ppm |
| 4 Jan 2023 | 454 ppm | 431 ppm | 440 ppm |
| 3 Jan 2023 | 450 ppm | 436 ppm | 436 ppm |
| 2 Jan 2023 | 448 ppm | 431 ppm | 423 ppm |
| 1 Jan 2023 | 451 ppm | 436 ppm | 422 ppm |
