Data is flowing again after several days’ work on maintenance and a significant improvement in our calibration of sensors. Courtesy of our scientific advisor Alistair Grinham (University of Queensland), we now have an accurate 400 ppm reference gas, which is closer to the range of the concentrations being monitored. We have also calibrated the three urban sensors together in an enclosed container at a range of CO2 concentrations between 400 and about 500 ppm – the range of interest, both by increasing and decreasing CO2 concentrations to check for hysteresis. This replaces a calibration using nitrogen to zero the sensors at 0 ppm. Any non-linearities in sensor behaviour between zero and the 400-500 ppm range would have been reflected in earlier observations. A consequence of this improvement is that the data reported up to and including 23 May 2023 should be regarded as less precise than data reported from today. We will label that as “Phase 1 data”, but retain it in the record, because “within-sensor” patterns such as the daily profiles and trends over time are still meaningful, while the “between-sensor” comparisons will be less accurate than Phase 2 data.
The new “Phase 2” series is based on calibration coefficients that include a correction for the very small differences between sensors. After recalibration at 400 ppm, all sensors were within 1 ppm of the 400 ppm reference gas, and at the highest CO2 calibration (~500 ppm based on the average of the three sensors as we do not have a 500 ppm reference gas), differences between the sensors were 1, 2 and 3 ppm. Corrections for those small differences have been included in the new calibration coefficients. Comparisons between the sites will be different and substantially more reliable than for Phase 1 data.
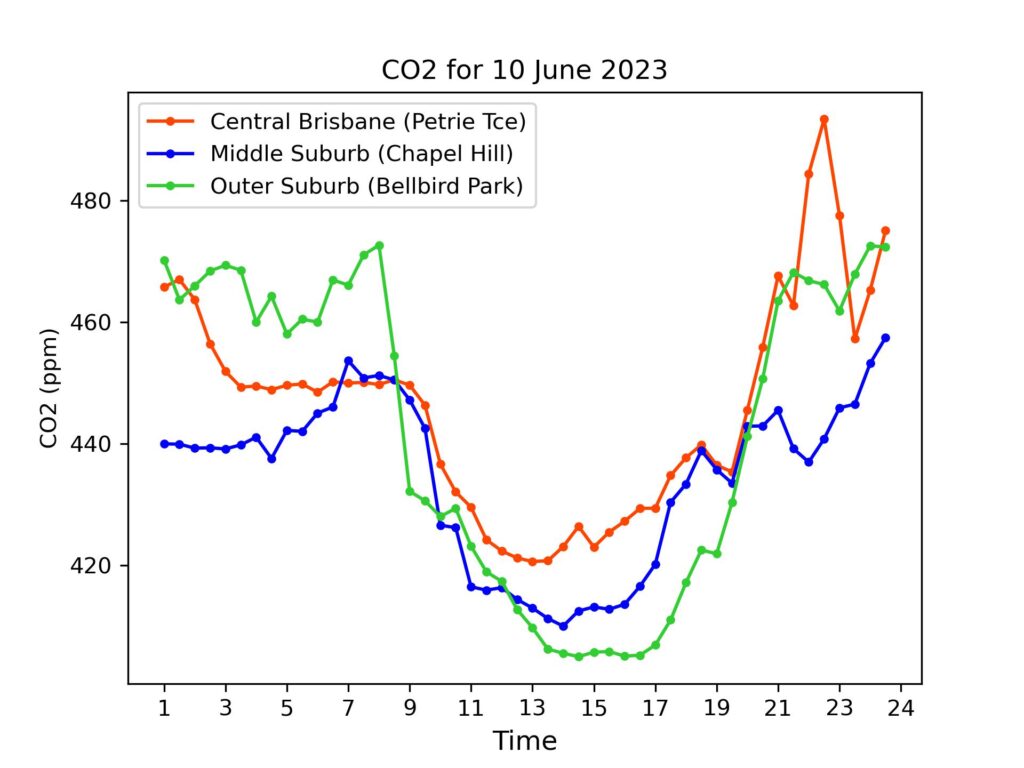
The first day of reported Phase 2 data is showing much more overlap between the sites, with interesting differences between day-time and night-time values. In coming days these new patterns will likely become more evident when averaging data across days and will be interesting to analyse and interpret.
Interested in hosting a site? Please leave us a message.
Daily Averages
For reference, latest monthly average (Apr 2023) from CSIRO for Kennaook/Cape Grim in NW Tasmania was 415.4 ppm. (Note – these are provisional values, subject to revision folllowing sensor re-calibrations and other checks.)
| Date | Petrie Terrace | Chapel Hill | Bellbird Park |
| 10 June 2023 | 446 ppm | 434 ppm | 442 ppm |