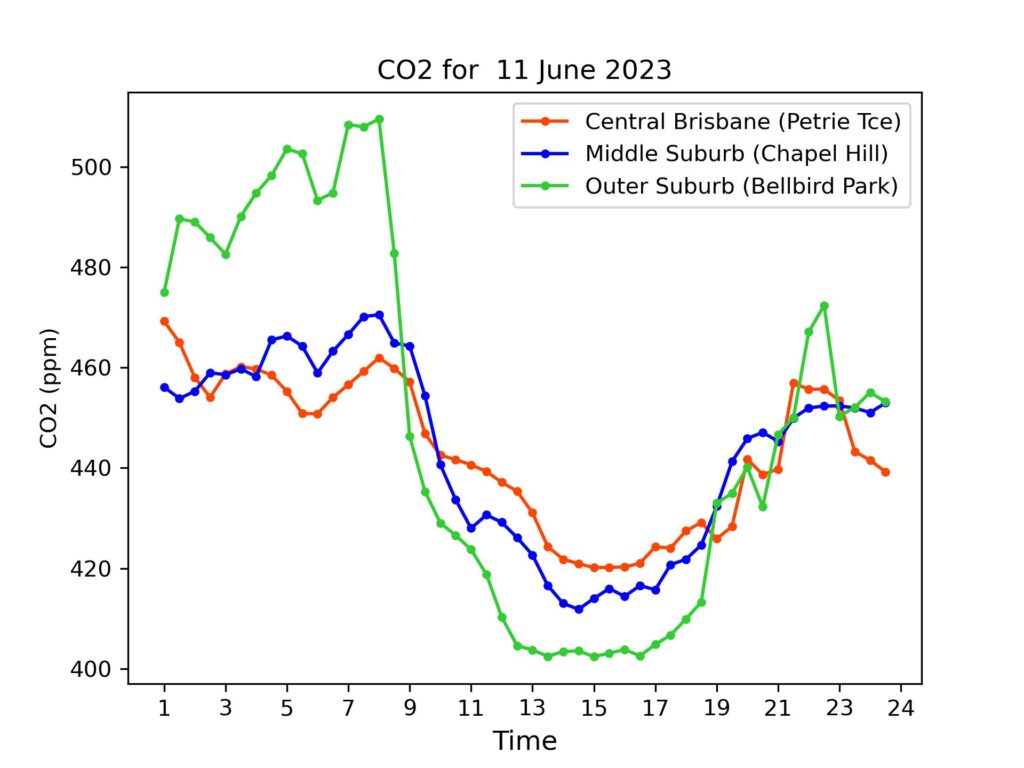
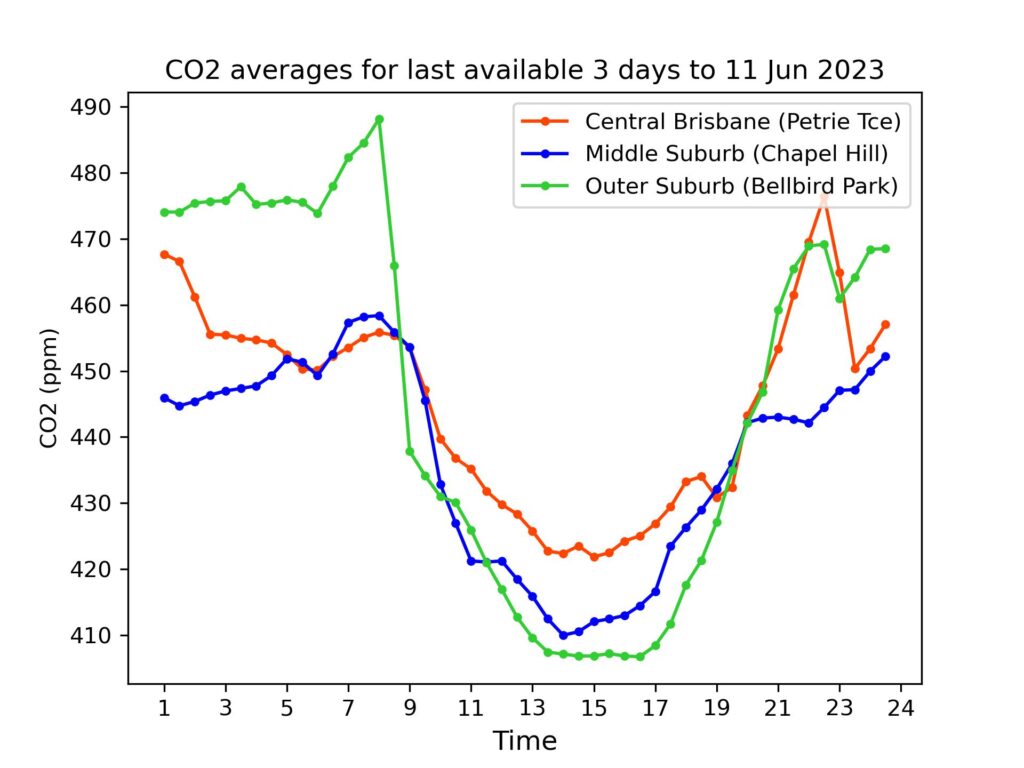
On the second day reporting Phase 2 data with recalibrated sensors (see explanation here) the overlap between the sites is again evident – and the daily average for Bellbird Park exceeded that for Petrie Terrace. This was attributable to its relatively high values between midnight and sunrise compared to the other sites, with daytime values higher in the CBD. Overall, the Chapel Hill site had lower values. We include a graph today showing the averages over the 24 hours for the first three days of this phase – over time this should provide a more stable indicator of how the concentrations behave at each of the three sites. The final graph is just a reminder of seasonal trends and long-term increases for “well-mixed air” in the Northern and Southern hemispheres.

Daily Averages – Phase 2 (See explanation of differences between Phase 1 and Phase 2 data)
For reference, latest monthly average (Apr 2023) from CSIRO for Kennaook/Cape Grim in NW Tasmania was 415.4 ppm. (Note – these are provisional values, subject to revision folllowing sensor re-calibrations and other checks.)
| Date | Petrie Terrace | Chapel Hill | Bellbird Park |
| 11-Jun-2023 | 443 ppm | 443 ppm | 449 ppm |
| 10-Jun-2023 | 446 ppm | 434 ppm | 442 ppm |
| 9-Jun-2023 | 440 ppm | 430 ppm | 438 ppm |