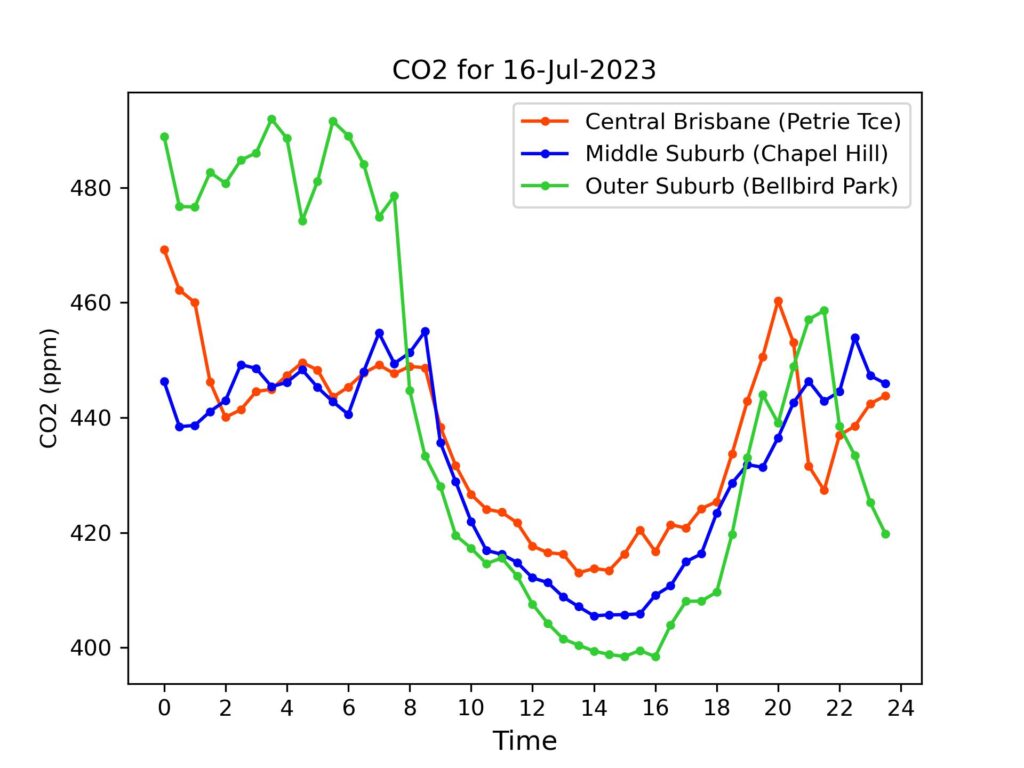
Average carbon dioxide concentration at the three sites in Brisbane fell slightly on Sunday to a mean of 436 ppm, a little above the average for Phase 2 data. On any given day, a site can show a pattern that differs to the others. On Sunday, the concentration at Bellbird Park started the day above 490 and ended it below 420 ppm, a substantial drop over the course of the day.
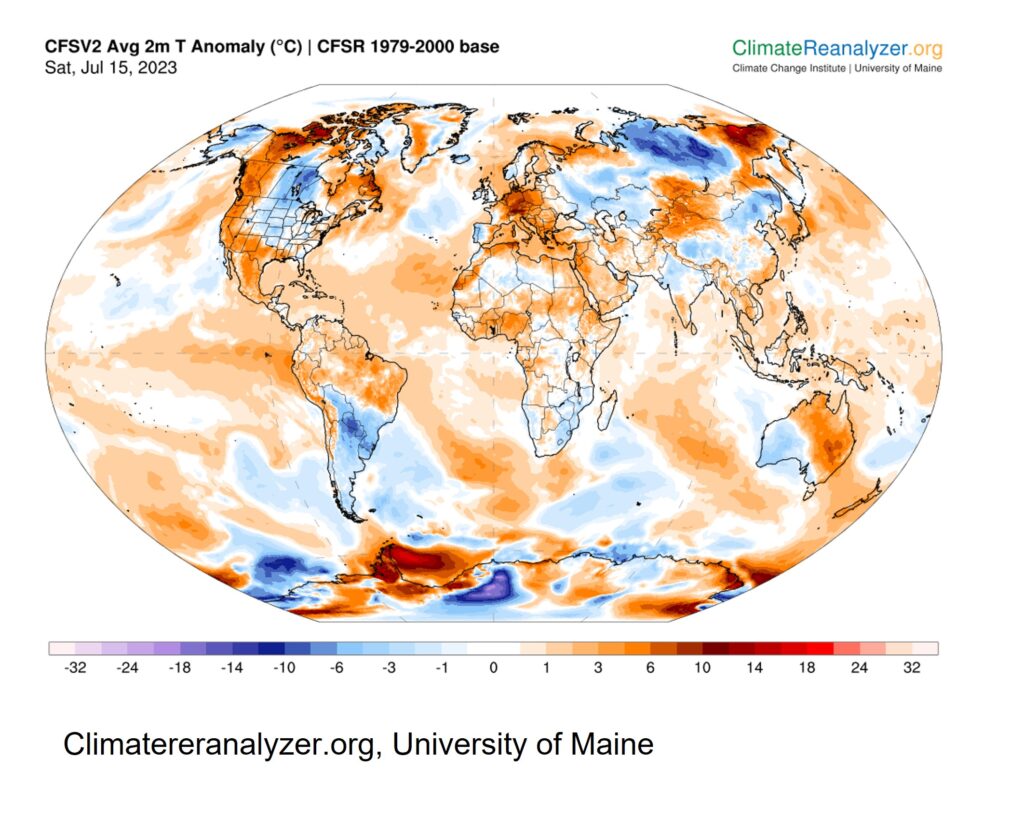
On the global front, just as it seemed the estimate of global average temperature reported in the NCEP Climate Forecast System (CFS) version 2 data-set was about to end its run of record highs, the latest data-point (for Saturday) showed a tiny up-tick. This made it 13 days in a row exceeding the temperature for any previous day in the 45 year record. Today’s third chart shows the distribution of global temperature anomalies (differences from multi-year average). The American west and south-west, Canadian east and the Mediterranean are regions experiencing heat-waves currently. These and other hotter than normal areas are more than off-setting cooler spots in S. America and north-central Russia. More information here.
Daily Averages – Phase 2 (See explanation of differences between Phase 1 and Phase 2 data)
For reference, latest monthly average (May 2023) from CSIRO for Kennaook/Cape Grim in NW Tasmania was 415.7 ppm. (Note – these are provisional values, subject to revision folllowing sensor re-calibrations and other checks.)
| Date | Petrie Terrace | Chapel Hill | Bellbird Park |
| 16-Jul-2023 | 436 ppm | 432 ppm | 441 ppm |
| 15-Jul-2023 | 449 ppm | 434 ppm | 452 ppm |
| 14-Jul-2023 | 452 ppm | 435 ppm | 448 ppm |
| 13-Jul-2023 | 433 ppm | 431 ppm | 429 ppm |
| 12-Jul-2023 | 437 ppm | 437 ppm | 438 ppm |
| 11-Jul-2023 | 448 ppm | 434 ppm | 438 ppm |
| 10-Jul-2023 | 439 ppm | 424 ppm | 432 ppm |
| 9-Jul-2023 | 423 ppm | 411 ppm | 417 ppm |
| 8-Jul-2023 | 418 ppm | 411 ppm | 414 ppm |
| 7-Jul-2023 | 413 ppm | 407 ppm | 408 ppm |
| 6-Jul-2023 | 434 ppm | 427 ppm | 428 ppm |
| 5-Jul-2023 | 442 ppm | 441 ppm | 429 ppm |
| 4-Jul-2023 | 449 ppm | 443 ppm | 429 ppm |
| 3-Jul-2023 | 428 ppm | 429 ppm | 412 ppm |
| 2-Jul-2023 | 424 ppm | 425 ppm | 414 ppm |
| 1-Jul-2023 | 419 ppm | 407 ppm | 405 ppm |
| 30-Jun-2023 | 414 ppm | 405 ppm | 402 ppm |
| 29-Jun-2023 | 415 ppm | 409 ppm | 405 ppm |
| 28-Jun-2023 | 435 ppm | 427 ppm | 428 ppm |
| 27-Jun-2023 | 426 ppm | 409 ppm | 415 ppm |
| 26-Jun-2023 | 412 ppm | 402 ppm | 412 ppm |
| 25-Jun-2023 | 447 ppm | 426 ppm | 429 ppm |
| 24-Jun-2023 | 427 ppm | 417 ppm | 423 ppm |
| 23-Jun-2023 | 434 ppm | 427 ppm | 435 ppm |
| 22-Jun-2023 | 442 ppm | 425 ppm | 436 ppm |
| 21-Jun-2023 | 443 ppm | 421 ppm | 437 ppm |
| 20-Jun-2023 | 421 ppm | 414 ppm | 417 ppm |
| 19-Jun-2023 | 430 ppm | 418 ppm | 419 ppm |
| 18-Jun-2023 | 436 ppm | 426 ppm | 434 ppm |
| 17-Jun-2023 | 440 ppm | 429 ppm | 437 ppm |
| 16-Jun-2023 | 438 ppm | 421 ppm | 433 ppm |
| 15-Jun-2023 | 433 ppm | 412 ppm | 428 ppm |
| 14-Jun-2023 | 435 ppm | 425 ppm | 438 ppm |
| 13-Jun-2023 | 441 ppm | 436 ppm | 442 ppm |
| 12-Jun-2023 | 442 ppm | 439 ppm | 448ppm |
| 11-Jun-2023 | 443 ppm | 441 ppm | 451 ppm |
| 10-Jun-2023 | 446 ppm | 432 ppm | 444 ppm |
| 9-Jun-2023 | 441 ppm | 428 ppm | 440ppm |