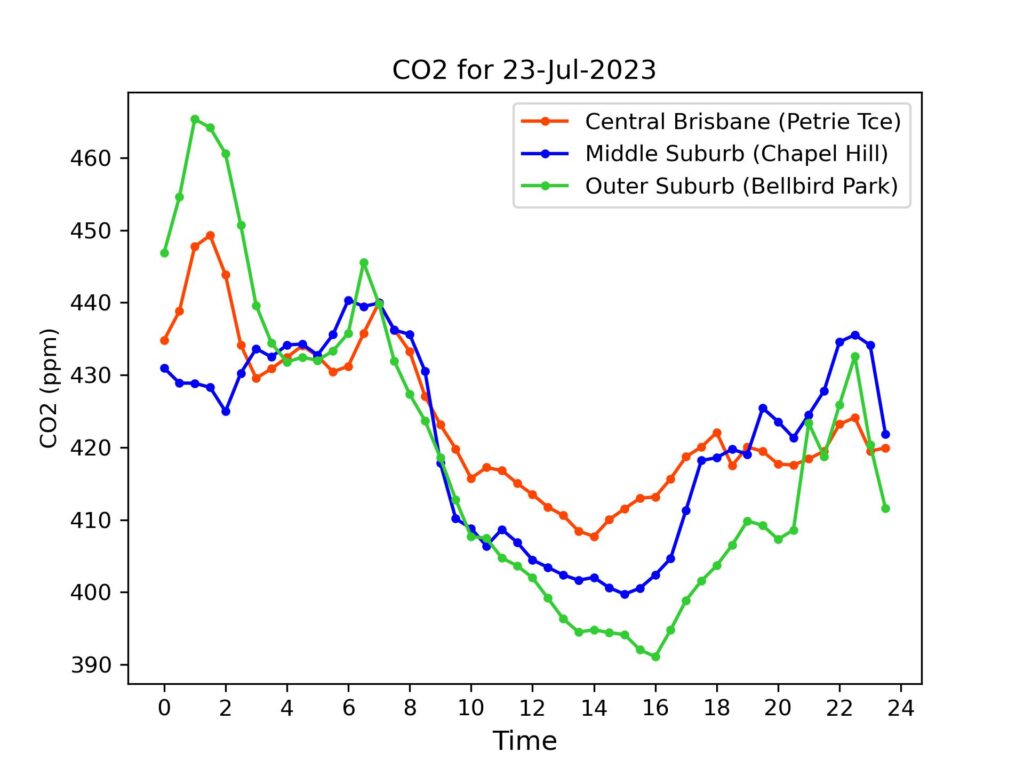
Carbon diooxide concentrations fell across the day on Sunday, withe daily averages lower than the average for the Phase 2 data so far. Diffferences between the three sites were also smaller than usual.
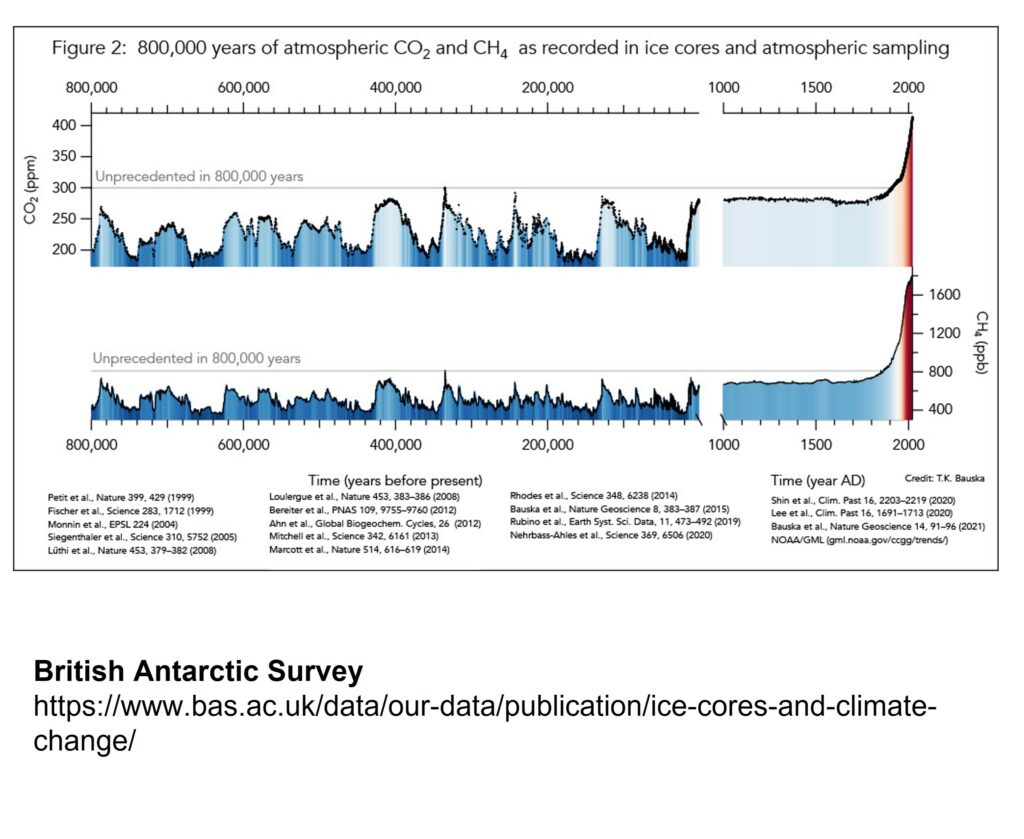
With the estimate of global average temperature reported in the NCEP Climate Forecast System (CFS) version 2 data-set now stretching to 20 consecutive days above the temperature for any previous day in its 45 year record, some scientists believe these are likely to be the highest global temperatures for about 120,000 years. These estimates are based on ice-core samples that provide a continuous 125,000 year record for Greenland and 800,000 years for the Antarctic. The third chart is from an excellent overview of these records and how they are interpreted, from the British Antarctic Survey.
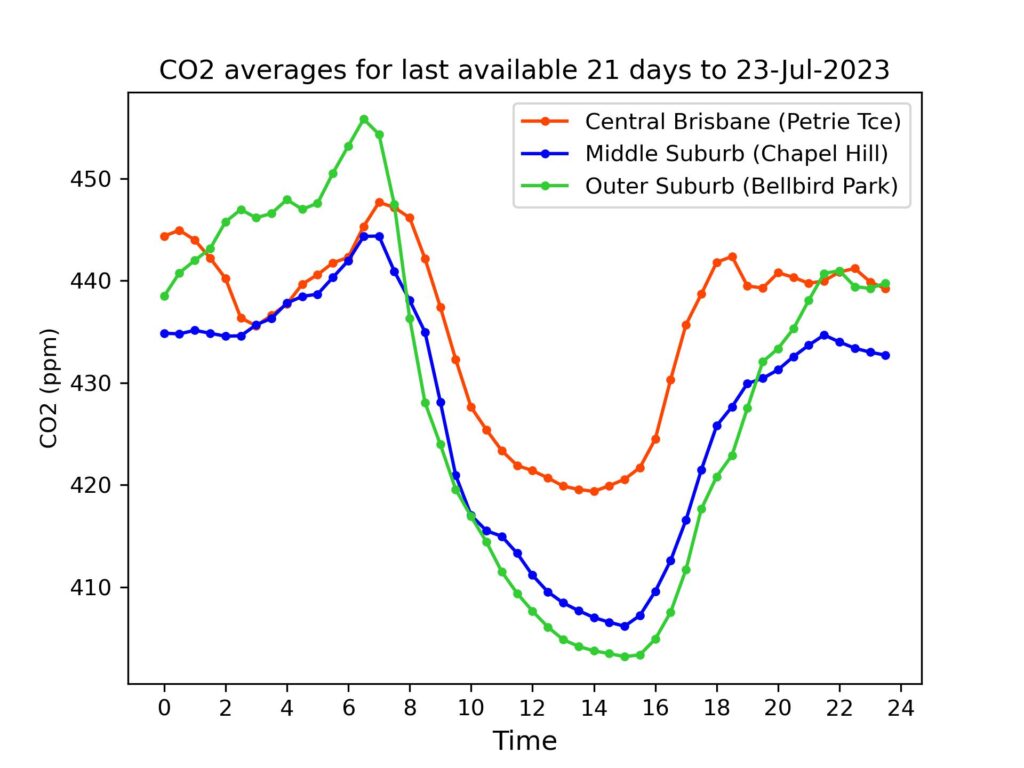
Daily Averages – Phase 2 (See explanation of differences between Phase 1 and Phase 2 data)
For reference, latest monthly average (May 2023) from CSIRO for Kennaook/Cape Grim in NW Tasmania was 415.7 ppm. (Note – these are provisional values, subject to revision folllowing sensor re-calibrations and other checks.)
| Date | Petrie Terrace | Chapel Hill | Bellbird Park |
| 23-Jul-2023 | 424 ppm | 421 ppm | 420 ppm |
| 22-Jul-2023 | 434 ppm | 429 ppm | 428 ppm |
| 21-Jul-2023 | 446 ppm | 430 ppm | — |
| 20-Jul-2023 | 433 ppm | 430 ppm | — |
| 19-Jul-2023 | 437 ppm | 436 ppm | 439 ppm |
| 18-Jul-2023 | 443 ppm | 432ppm | 433 ppm |
| 17-Jul-2023 | 435 ppm | 432 ppm | 436 ppm |
| 16-Jul-2023 | 436 ppm | 432 ppm | 441 ppm |
| 15-Jul-2023 | 449 ppm | 434 ppm | 452 ppm |
| 14-Jul-2023 | 452 ppm | 435 ppm | 448 ppm |
| 13-Jul-2023 | 433 ppm | 431 ppm | 429 ppm |
| 12-Jul-2023 | 437 ppm | 437 ppm | 438 ppm |
| 11-Jul-2023 | 448 ppm | 434 ppm | 438 ppm |
| 10-Jul-2023 | 439 ppm | 424 ppm | 432 ppm |
| 9-Jul-2023 | 423 ppm | 411 ppm | 417 ppm |
| 8-Jul-2023 | 418 ppm | 411 ppm | 414 ppm |
| 7-Jul-2023 | 413 ppm | 407 ppm | 408 ppm |
| 6-Jul-2023 | 434 ppm | 427 ppm | 428 ppm |
| 5-Jul-2023 | 442 ppm | 441 ppm | 429 ppm |
| 4-Jul-2023 | 449 ppm | 443 ppm | 429 ppm |
| 3-Jul-2023 | 428 ppm | 429 ppm | 412 ppm |
| 2-Jul-2023 | 424 ppm | 425 ppm | 414 ppm |
| 1-Jul-2023 | 419 ppm | 407 ppm | 405 ppm |
| 30-Jun-2023 | 414 ppm | 405 ppm | 402 ppm |
| 29-Jun-2023 | 415 ppm | 409 ppm | 405 ppm |
| 28-Jun-2023 | 435 ppm | 427 ppm | 428 ppm |
| 27-Jun-2023 | 426 ppm | 409 ppm | 415 ppm |
| 26-Jun-2023 | 412 ppm | 402 ppm | 412 ppm |
| 25-Jun-2023 | 447 ppm | 426 ppm | 429 ppm |
| 24-Jun-2023 | 427 ppm | 417 ppm | 423 ppm |
| 23-Jun-2023 | 434 ppm | 427 ppm | 435 ppm |
| 22-Jun-2023 | 442 ppm | 425 ppm | 436 ppm |
| 21-Jun-2023 | 443 ppm | 421 ppm | 437 ppm |
| 20-Jun-2023 | 421 ppm | 414 ppm | 417 ppm |
| 19-Jun-2023 | 430 ppm | 418 ppm | 419 ppm |
| 18-Jun-2023 | 436 ppm | 426 ppm | 434 ppm |
| 17-Jun-2023 | 440 ppm | 429 ppm | 437 ppm |
| 16-Jun-2023 | 438 ppm | 421 ppm | 433 ppm |
| 15-Jun-2023 | 433 ppm | 412 ppm | 428 ppm |
| 14-Jun-2023 | 435 ppm | 425 ppm | 438 ppm |
| 13-Jun-2023 | 441 ppm | 436 ppm | 442 ppm |
| 12-Jun-2023 | 442 ppm | 439 ppm | 448ppm |
| 11-Jun-2023 | 443 ppm | 441 ppm | 451 ppm |
| 10-Jun-2023 | 446 ppm | 432 ppm | 444 ppm |
| 9-Jun-2023 | 441 ppm | 428 ppm | 440ppm |