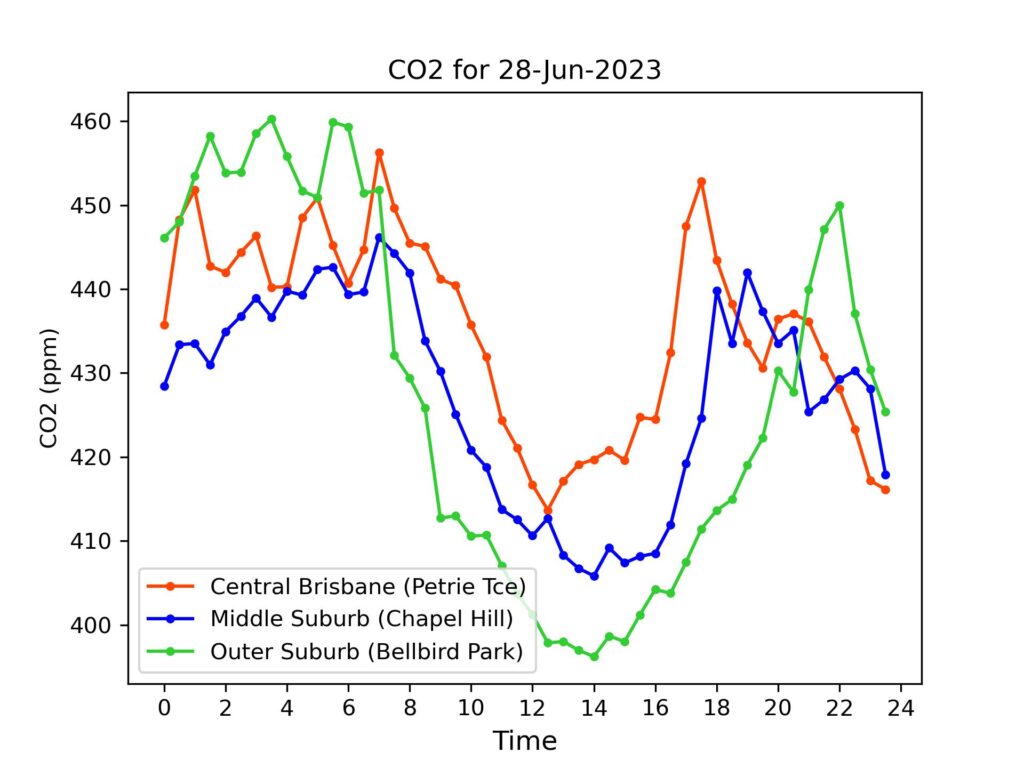
A very different and more normal pattern today than yesterday, which began with quite low levels. It’s noteworthy that the very low levels (average concentration at 409 ppm) on Monday (26 June) seen at all three sites coincided with strong winds from the west (26 km/h at Archerfield at both 9 a.m. and 3 p.m.). In contrast, the highest averages across the three sites for June (in Phase 2 data) occurred on June 11 and 12 (445 and 443 ppm), two days of low or no winds. This is consistent with higher carbon dioxide concentrations accumulating in calm weather, and being diluted when fresh winds blow across the city, especially from the west where two of the monitors are located, meaning that these winds travel over relatively less urban land.
Daily Averages – Phase 2 (See explanation of differences between Phase 1 and Phase 2 data)
For reference, latest monthly average (Apr 2023) from CSIRO for Kennaook/Cape Grim in NW Tasmania was 415.4 ppm. (Note – these are provisional values, subject to revision folllowing sensor re-calibrations and other checks.)
| Date | Petrie Terrace | Chapel Hill | Bellbird Park |
| 28-Jun-2023 | 435 ppm | 427 ppm | 428 ppm |
| 27-Jun-2023 | 426 ppm | 409 ppm | 415 ppm |
| 26-Jun-2023 | 412 ppm | 402 ppm | 412 ppm |
| 25-Jun-2023 | 447 ppm | 426 ppm | 429 ppm |
| 24-Jun-2023 | 427 ppm | 417 ppm | 423 ppm |
| 23-Jun-2023 | 434 ppm | 427 ppm | 435 ppm |
| 22-Jun-2023 | 442 ppm | 425 ppm | 436 ppm |
| 21-Jun-2023 | 443 ppm | 421 ppm | 437 ppm |
| 20-Jun-2023 | 421 ppm | 414 ppm | 417 ppm |
| 19-Jun-2023 | 430 ppm | 418 ppm | 419 ppm |
| 18-Jun-2023 | 436 ppm | 426 ppm | 434 ppm |
| 17-Jun-2023 | 440 ppm | 429 ppm | 437 ppm |
| 16-Jun-2023 | 438 ppm | 421 ppm | 433 ppm |
| 15-Jun-2023 | 433 ppm | 412 ppm | 428 ppm |
| 14-Jun-2023 | 435 ppm | 425 ppm | 438 ppm |
| 13-Jun-2023 | 441 ppm | 436 ppm | 442 ppm |
| 12-Jun-2023 | 442 ppm | 439 ppm | 448ppm |
| 11-Jun-2023 | 443 ppm | 441 ppm | 451 ppm |
| 10-Jun-2023 | 446 ppm | 432 ppm | 4444 ppm |
| 9-Jun-2023 | 441 ppm | 428 ppm | 440ppm |