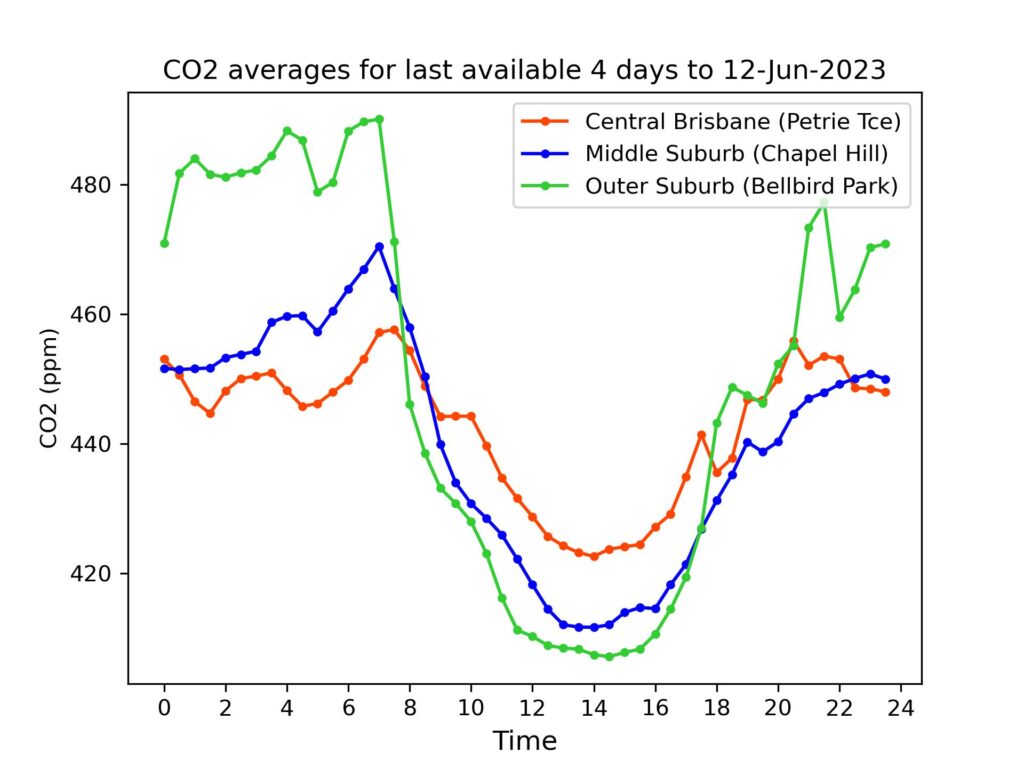
Early days for Phase 2 data (see explanation here) so not too much should be read into patterns just yet. Nonetheless, the second graph, averaging the last four days, suggests an apparent difference between daytime and nighttime values at the three sites. The city centre site shows higher carbon dioxide concentrations in daylight hours, and the city edge site has higher values in darkness. Since comparisons between sites can now be made with much more confidence than was true for Phase 1 data, this reversal will be interesting to track and understand. The addition of more monitoring sites will be crucial to this understanding, to help differentiate between effects that are highly localised and unique, from those that represent the various parts of the urban area robustly. A feature of the data that has not changed between Phase 1 and Phase 2 is that the overall values are clearly higher than well-mixed air measured for Australia – which averaged 415.4 ppm in April at Kennaook/Cape Grim. This makes Brisbane’s CO2 levels in the last four days some 26 ppm above that background level.
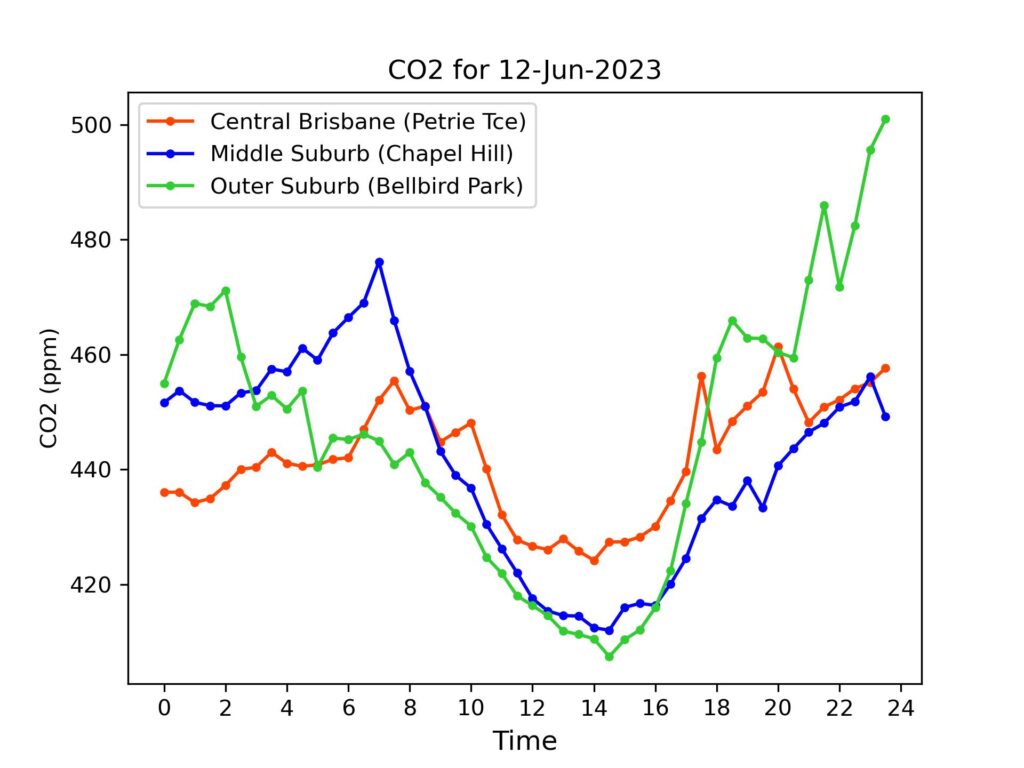

Daily Averages – Phase 2 (See explanation of differences between Phase 1 and Phase 2 data)
For reference, latest monthly average (Apr 2023) from CSIRO for Kennaook/Cape Grim in NW Tasmania was 415.4 ppm. (Note – these are provisional values, subject to revision folllowing sensor re-calibrations and other checks.)
| Date | Petrie Terrace | Chapel Hill | Bellbird Park |
| 12-Jun-2023 | 442 ppm | 441 ppm | 446ppm |
| 11-Jun-2023 | 443 ppm | 443 ppm | 449 ppm |
| 10-Jun-2023 | 446 ppm | 434 ppm | 442 ppm |
| 9-Jun-2023 | 440 ppm | 430 ppm | 438 ppm |