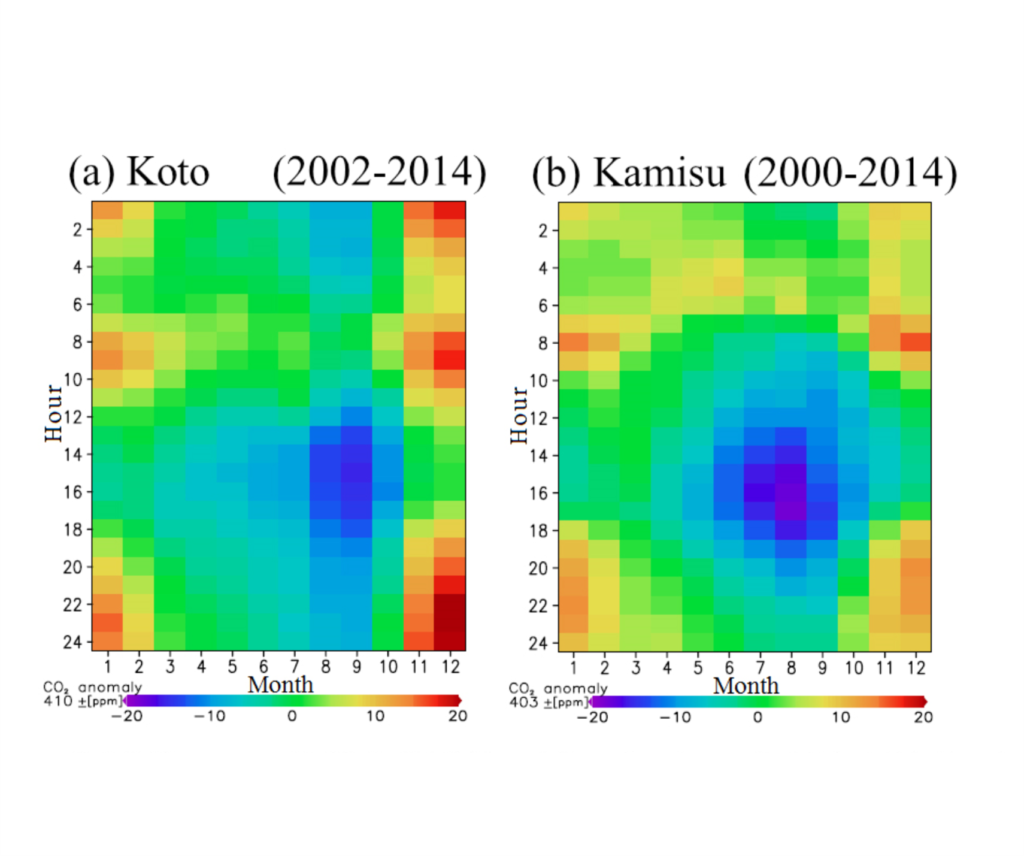
A relatively low level at Chapel Hill on Thursday in Phase 2 data (see explanation here). Today’s third graph shows data for two sites from a multi-yearstudy of localities in and around Tokyo. Blue indicates values below average, red those above. Note that the early afternoon values are particularly low in the summer months (the blue patches) – when photosynthesis is most pronounced. As a sub-tropical city, we don’t expect Brisbane to show such clear-cut seasonal differences. (Note the time of day effect is similar, though – but time is shown on the y-axis, not the x-axis. Imasu, Ryoichi, and Yuka Tanabe. ‘Diurnal and Seasonal Variations of Carbon Dioxide (CO2) Concentration in Urban, Suburban, and Rural Areas around Tokyo’. Atmosphere 9, no. 10 (October 2018): 367. https://doi.org/10.3390/atmos9100367.
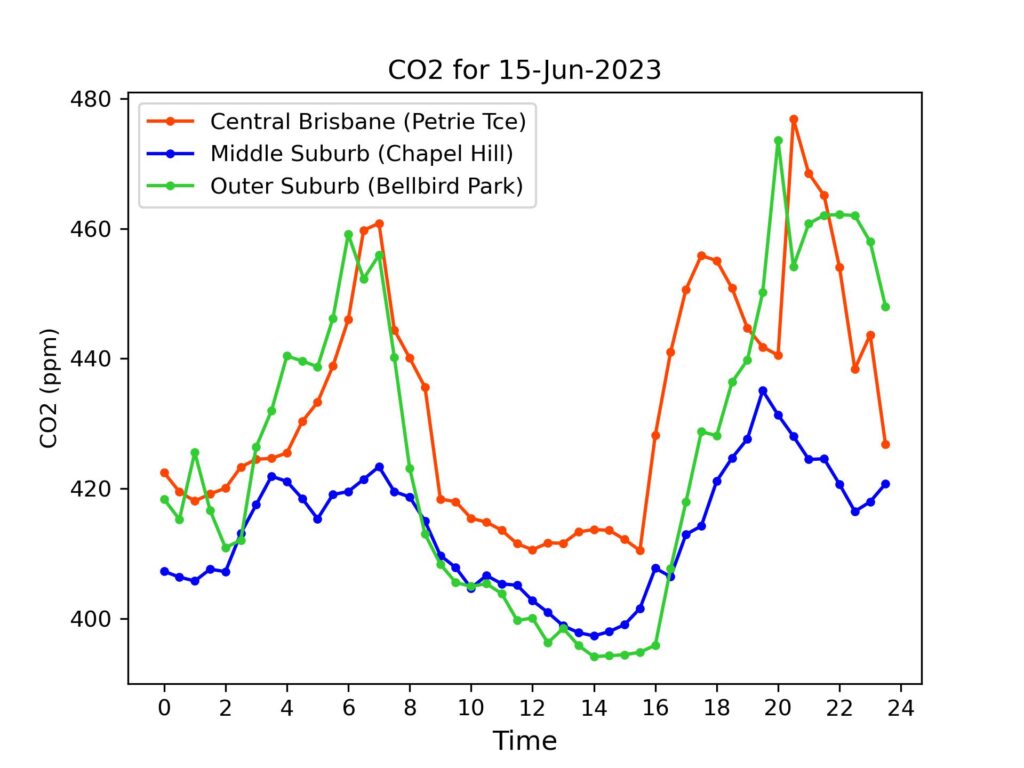
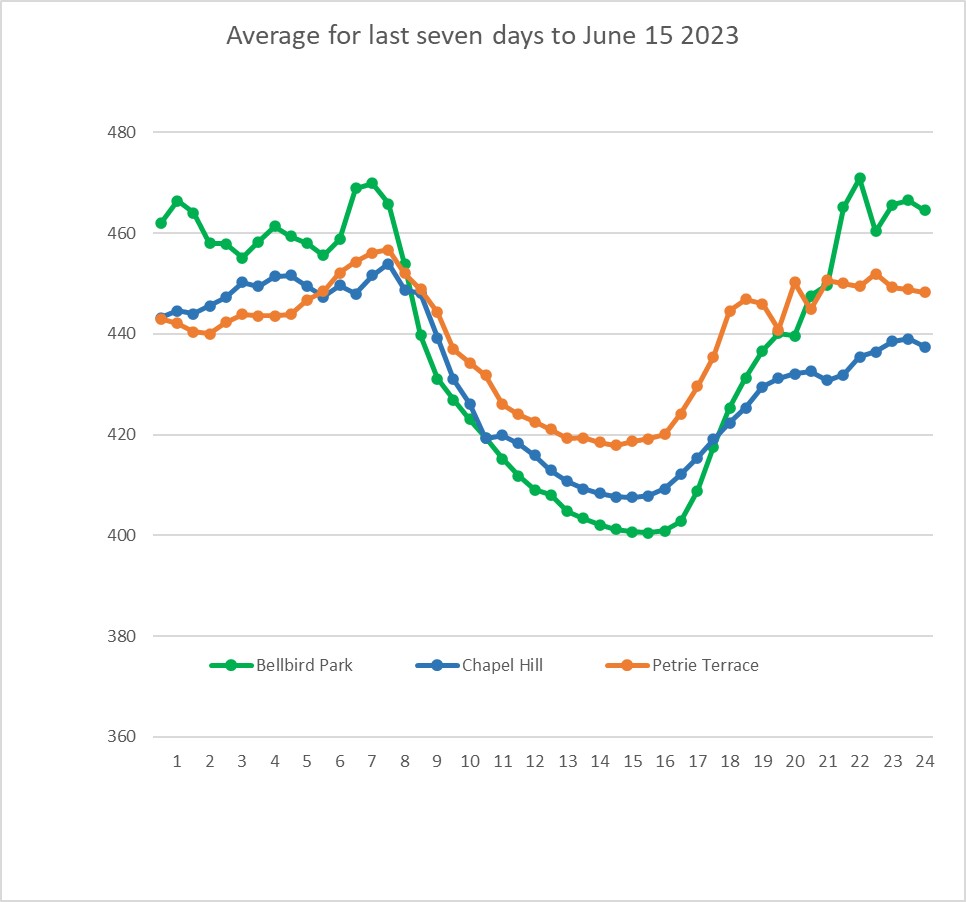
Daily Averages – Phase 2 (See explanation of differences between Phase 1 and Phase 2 data)
For reference, latest monthly average (Apr 2023) from CSIRO for Kennaook/Cape Grim in NW Tasmania was 415.4 ppm. (Note – these are provisional values, subject to revision folllowing sensor re-calibrations and other checks.)
| Date | Petrie Terrace | Chapel Hill | Bellbird Park |
| 15-Jun-2023 | 432 ppm | 413 ppm | 426 ppm |
| 14-Jun-2023 | 435 ppm | 427 ppm | 436 ppm |
| 13-Jun-2023 | 441 ppm | 438 ppm | 440 ppm |
| 12-Jun-2023 | 442 ppm | 441 ppm | 446ppm |
| 11-Jun-2023 | 443 ppm | 443 ppm | 449 ppm |
| 10-Jun-2023 | 446 ppm | 434 ppm | 442 ppm |
| 9-Jun-2023 | 440 ppm | 430 ppm | 438 ppm |