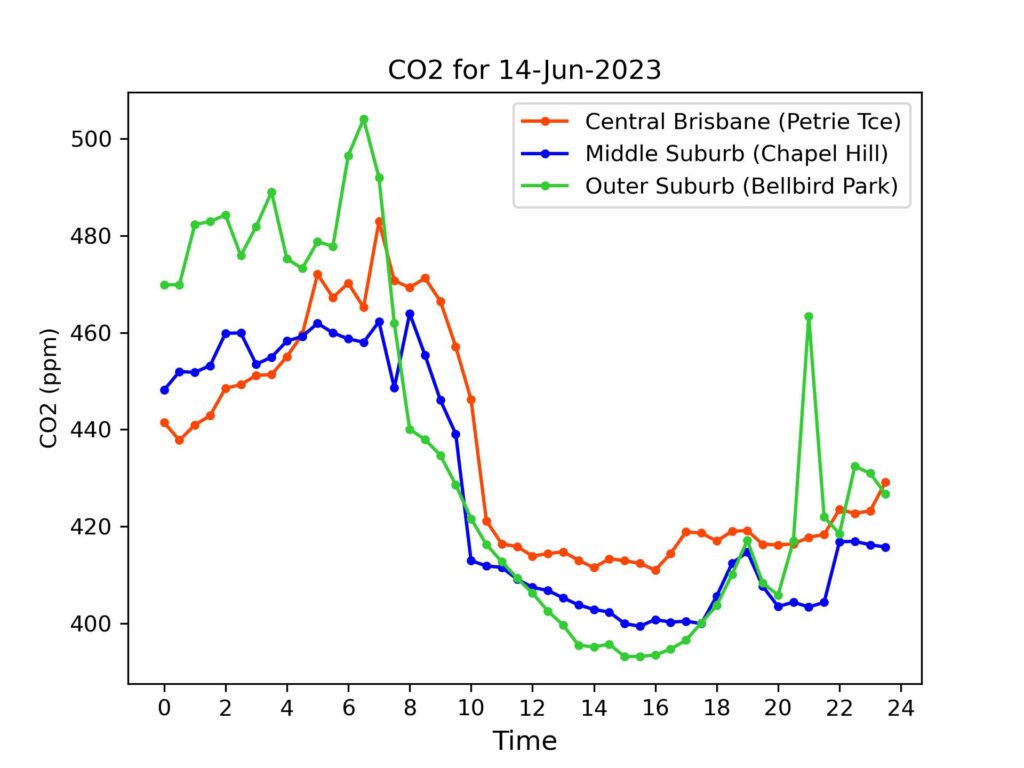
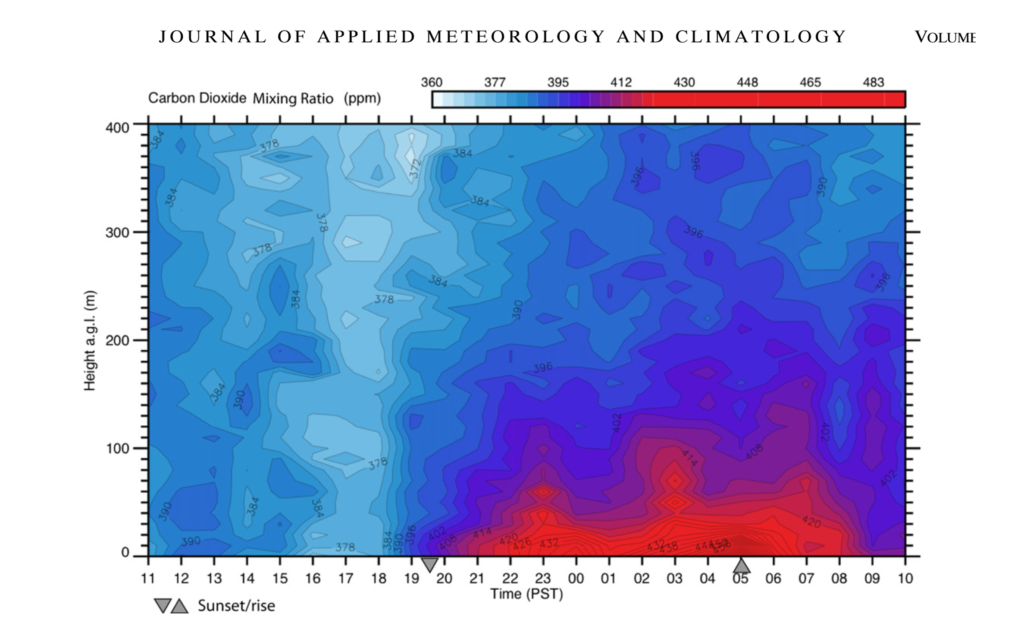
A big fall in levels during the course of Wednesday in Phase 2 data (see explanation here). How do ground level CO2 concentrations differ across the day compared to well-mixed air at higher altitudes? Today’s final graph shows concentrations (blue – lower, red – higher) across the day, with the y-axis running from ground level to 400 m, from a large study in Vancouver. Notice that at higher altitudes there is less variation across the day (all shades of blue), while at ground level (comparable to our sensors) and up to about 100 m, a large red patch emerges after dark and remains until sunrise. This is the diurnal cycle apparent in our Brisbane data – lowest concentrations in the mid-afternoon – highest concentrations just before dawn. Crawford, B., A. Christen, and I. McKendry. ‘Diurnal Course of Carbon Dioxide Mixing Ratios in the Urban Boundary Layer in Response to Surface Emissions’. Journal of Applied Meteorology and Climatology 55, no. 3 (1 March 2016): 507–29. https://doi.org/10.1175/JAMC-D-15-0060.1.
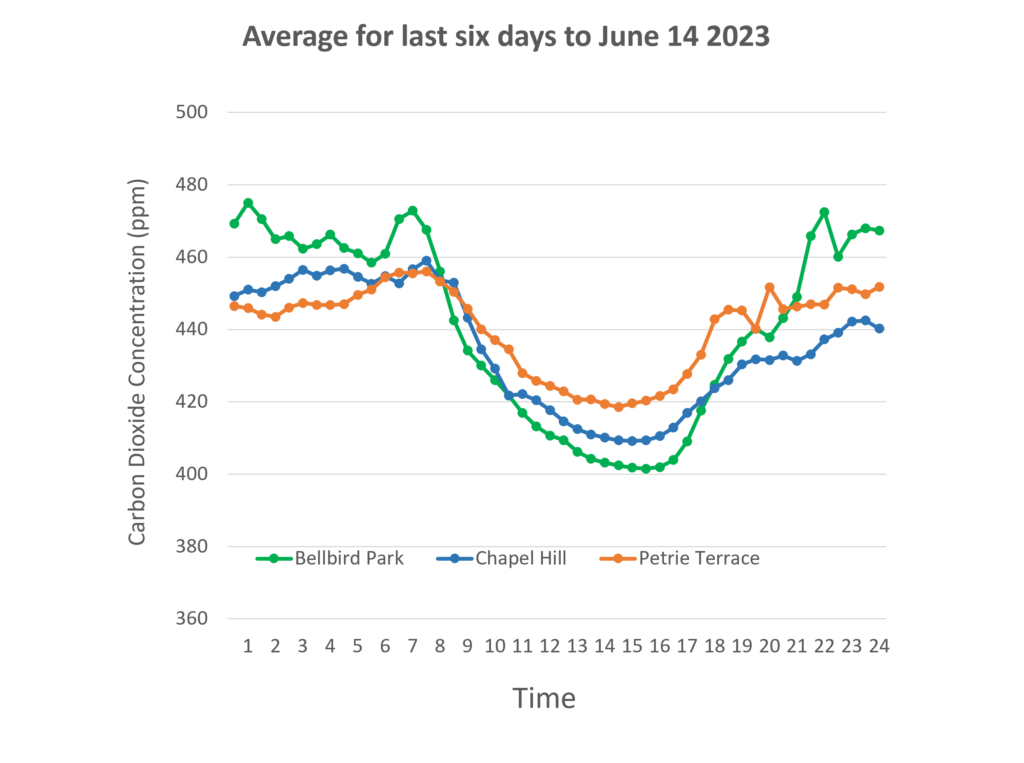
Daily Averages – Phase 2 (See explanation of differences between Phase 1 and Phase 2 data)
For reference, latest monthly average (Apr 2023) from CSIRO for Kennaook/Cape Grim in NW Tasmania was 415.4 ppm. (Note – these are provisional values, subject to revision folllowing sensor re-calibrations and other checks.)
| Date | Petrie Terrace | Chapel Hill | Bellbird Park |
| 14-Jun-2023 | 435 ppm | 427 ppm | 436 ppm |
| 13-Jun-2023 | 441 ppm | 438 ppm | 440 ppm |
| 12-Jun-2023 | 442 ppm | 441 ppm | 446ppm |
| 11-Jun-2023 | 443 ppm | 443 ppm | 449 ppm |
| 10-Jun-2023 | 446 ppm | 434 ppm | 442 ppm |
| 9-Jun-2023 | 440 ppm | 430 ppm | 438 ppm |