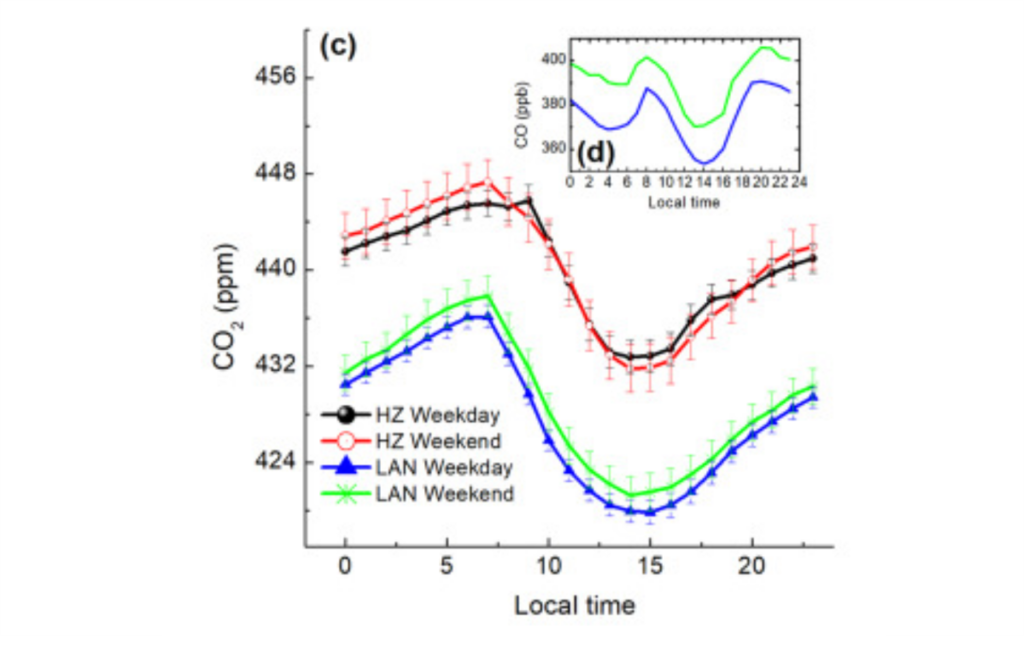
On Saturday no major changes in the patterns of Phase 2 data (see explanation here). Today’s third graph shows comparable averaged data for two sites in Hangzhou (HZ), an industrial and high emissions area of China, and Lin’an (LAN), a suburban area, for weekdays and weekends. Fang, Shuangxi, Rongguang Du, Bing Qi, Qianli Ma, Guizhen Zhang, Binjiang Chen, and Jiayue Li. ‘Variation of Carbon Dioxide Mole Fraction at a Typical Urban Area in the Yangtze River Delta, China’. Atmospheric Research 265 (1 January 2022): 105884. https://doi.org/10.1016/j.atmosres.2021.105884.
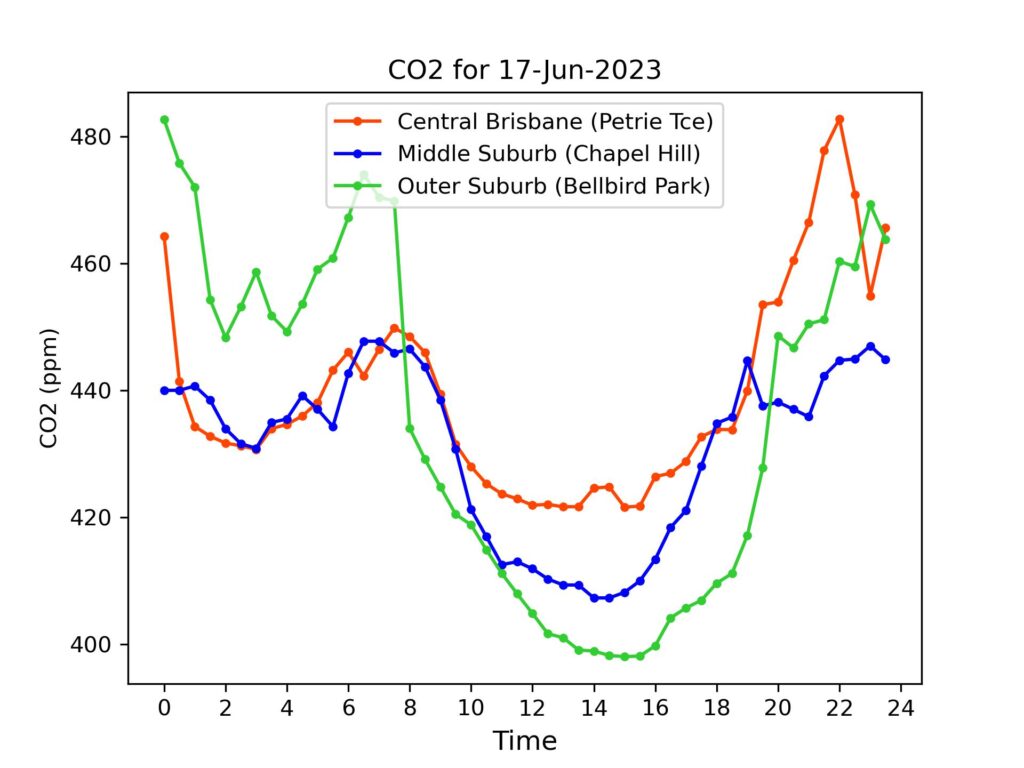
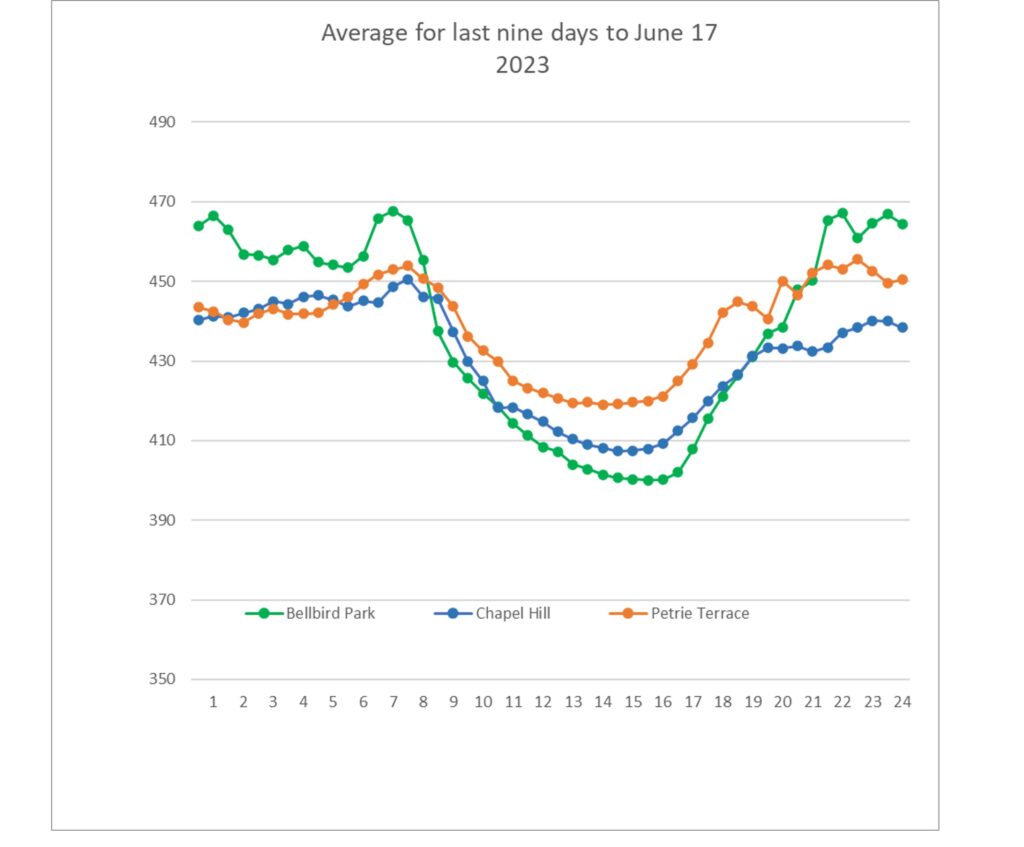
Daily Averages – Phase 2 (See explanation of differences between Phase 1 and Phase 2 data)
For reference, latest monthly average (Apr 2023) from CSIRO for Kennaook/Cape Grim in NW Tasmania was 415.4 ppm. (Note – these are provisional values, subject to revision folllowing sensor re-calibrations and other checks.)
| Date | Petrie Terrace | Chapel Hill | Bellbird Park |
| 17-Jun-2023 | 439 ppm | 431 ppm | 435 ppm |
| 16-Jun-2023 | 437 ppm | 423 ppm | 431 ppm |
| 15-Jun-2023 | 432 ppm | 413 ppm | 426 ppm |
| 14-Jun-2023 | 435 ppm | 427 ppm | 436 ppm |
| 13-Jun-2023 | 441 ppm | 438 ppm | 440 ppm |
| 12-Jun-2023 | 442 ppm | 441 ppm | 446ppm |
| 11-Jun-2023 | 443 ppm | 443 ppm | 449 ppm |
| 10-Jun-2023 | 446 ppm | 434 ppm | 442 ppm |
| 9-Jun-2023 | 440 ppm | 430 ppm | 438 ppm |