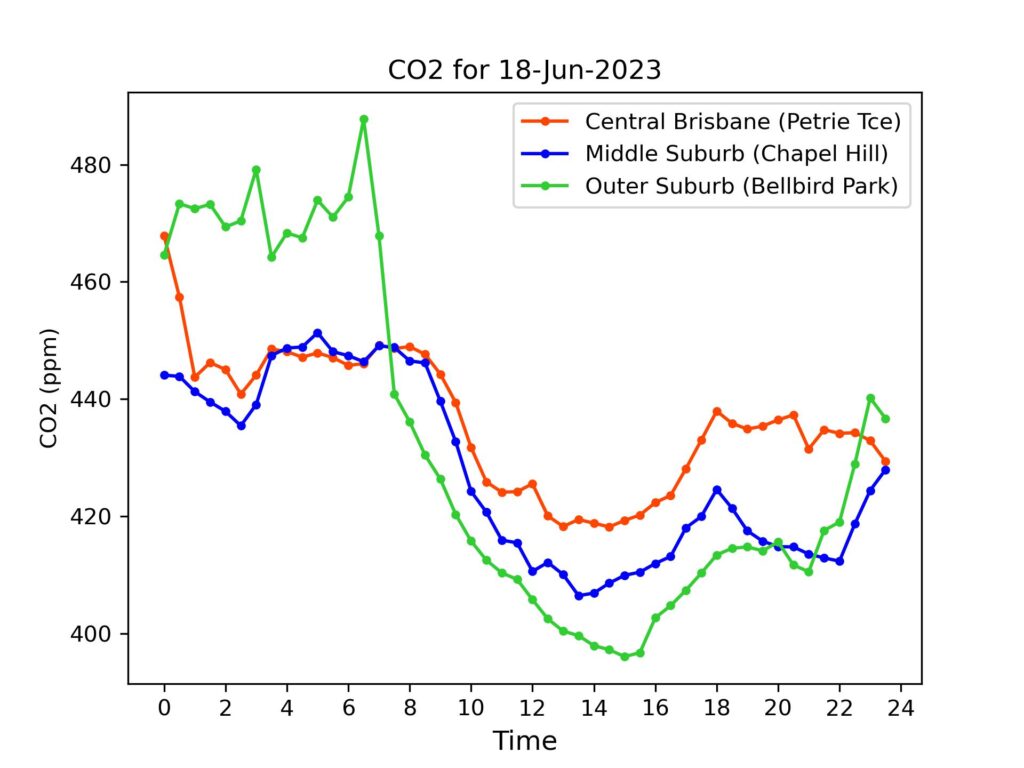
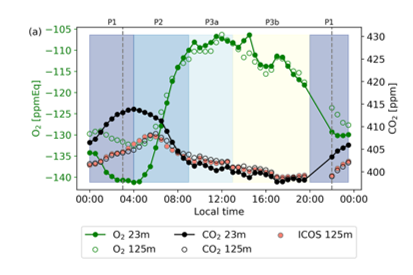
On Sunday there was an overal drop in concentrations at the three sites by the end of the day, the lagest drop being at the city centre site (Petrie Terrace), in this tenth day of Phase 2 data (see explanation here). Today’s third graph shows data for concentrations (black dots and open black circles) for two heights above a southern Finnish boreal forest. Faassen, Kim A. P., Linh N. T. Nguyen, Eadin R. Broekema, Bert A. M. Kers, Ivan Mammarella, Timo Vesala, Penelope A. Pickers, et al. ‘Diurnal Variability of Atmospheric O2, CO2, and Their Exchange Ratio above a Boreal Forest in Southern Finland’. Atmospheric Chemistry and Physics 23, no. 2 (19 January 2023): 851–76. https://doi.org/10.5194/acp-23-851-2023.
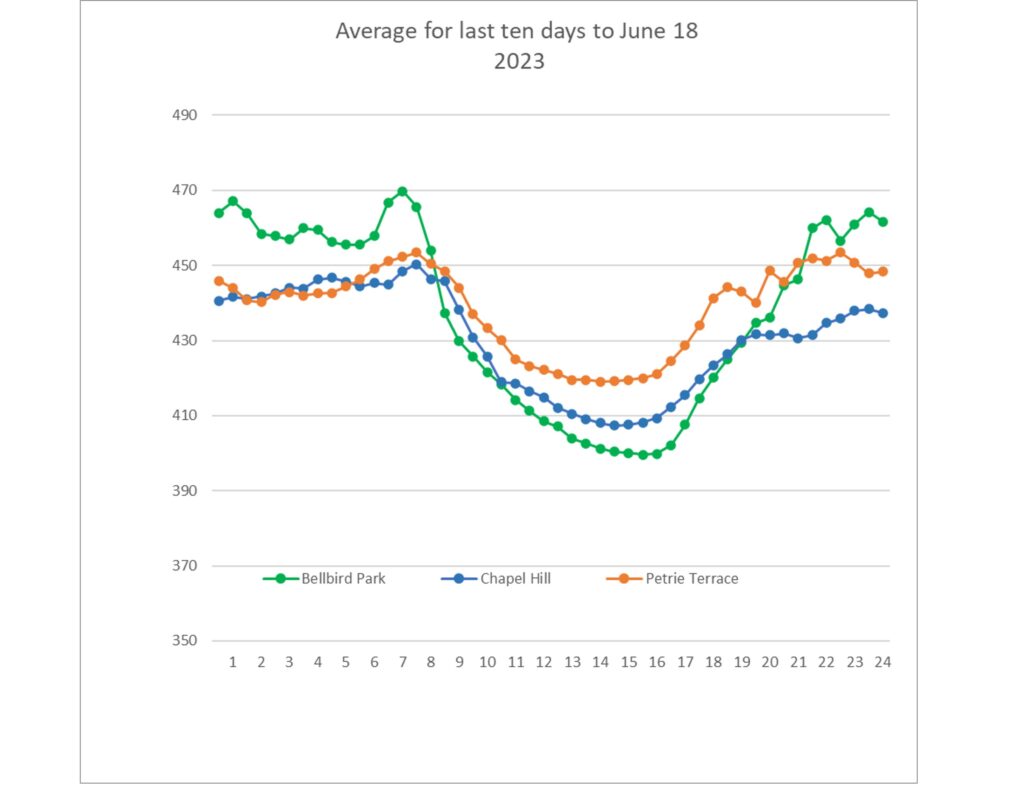
Daily Averages – Phase 2 (See explanation of differences between Phase 1 and Phase 2 data)
For reference, latest monthly average (Apr 2023) from CSIRO for Kennaook/Cape Grim in NW Tasmania was 415.4 ppm. (Note – these are provisional values, subject to revision folllowing sensor re-calibrations and other checks.)
| Date | Petrie Terrace | Chapel Hill | Bellbird Park |
| 18-Jun-2023 | 436 ppm | 427 ppm | 432 ppm |
| 17-Jun-2023 | 439 ppm | 431 ppm | 435 ppm |
| 16-Jun-2023 | 437 ppm | 423 ppm | 431 ppm |
| 15-Jun-2023 | 432 ppm | 413 ppm | 426 ppm |
| 14-Jun-2023 | 435 ppm | 427 ppm | 436 ppm |
| 13-Jun-2023 | 441 ppm | 438 ppm | 440 ppm |
| 12-Jun-2023 | 442 ppm | 441 ppm | 446ppm |
| 11-Jun-2023 | 443 ppm | 443 ppm | 449 ppm |
| 10-Jun-2023 | 446 ppm | 434 ppm | 442 ppm |
| 9-Jun-2023 | 440 ppm | 430 ppm | 438 ppm |