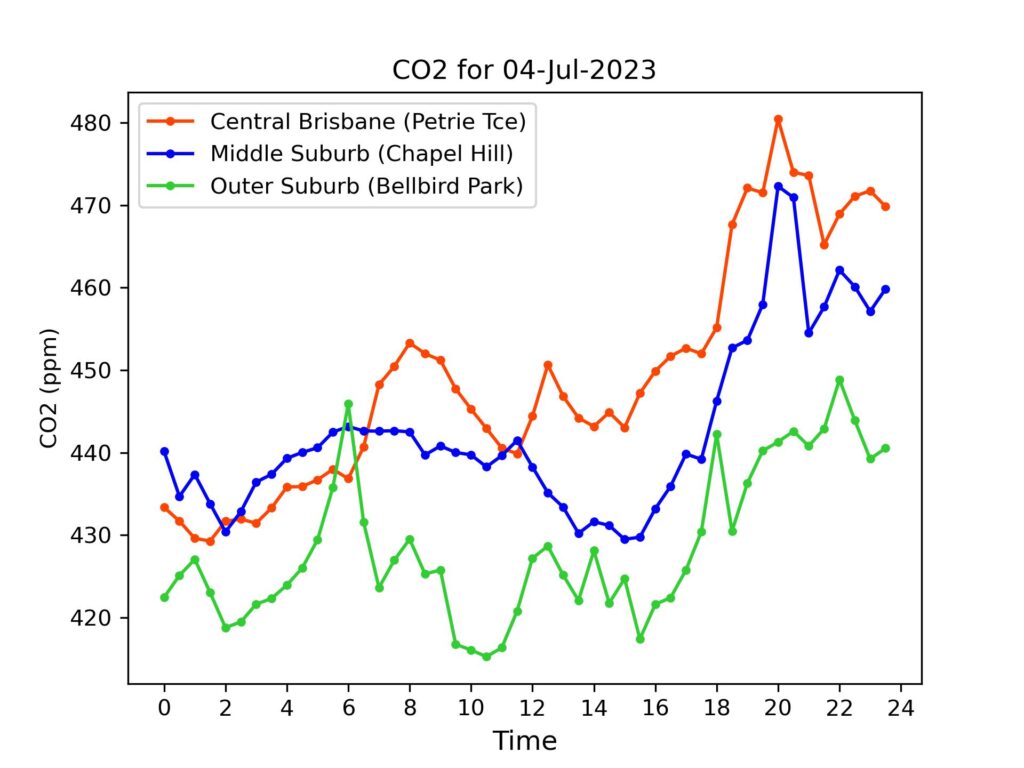
Much higher levels on Tuesday following several days of stronger, predominantly westerly winds. All three sites averaged above the recent background level measured by CSIRO at Kennaook/Cape Grim from air streaming in from the Southern Ocean. These differences were +33, +27 and +19 ppm for the CBD (Petrie Terrace), a middle suburb (Chapel Hill), and city edge (Bellbird Park), respectively. The build-up in carbon dioxide concentrations across the day – apparent in the first graph – may have resulted from the much lower wind speeds (9 and 6 km/h at 9 a.m. and 3 p.m. measured at Archerfield), conditions which allow emissions to accumulate.
Daily Averages – Phase 2 (See explanation of differences between Phase 1 and Phase 2 data)
For reference, latest monthly average (May 2023) from CSIRO for Kennaook/Cape Grim in NW Tasmania was 415.7 ppm. (Note – these are provisional values, subject to revision folllowing sensor re-calibrations and other checks.)
| Date | Petrie Terrace | Chapel Hill | Bellbird Park |
| 4-Jul-2023 | 449 ppm | 443 ppm | 429 ppm |
| 3-Jul-2023 | 428 ppm | 429 ppm | 412 ppm |
| 2-Jul-2023 | 424 ppm | 425 ppm | 414 ppm |
| 1-Jul-2023 | 419 ppm | 407 ppm | 405 ppm |
| 30-Jun-2023 | 414 ppm | 405 ppm | 402 ppm |
| 29-Jun-2023 | 415 ppm | 409 ppm | 405 ppm |
| 28-Jun-2023 | 435 ppm | 427 ppm | 428 ppm |
| 27-Jun-2023 | 426 ppm | 409 ppm | 415 ppm |
| 26-Jun-2023 | 412 ppm | 402 ppm | 412 ppm |
| 25-Jun-2023 | 447 ppm | 426 ppm | 429 ppm |
| 24-Jun-2023 | 427 ppm | 417 ppm | 423 ppm |
| 23-Jun-2023 | 434 ppm | 427 ppm | 435 ppm |
| 22-Jun-2023 | 442 ppm | 425 ppm | 436 ppm |
| 21-Jun-2023 | 443 ppm | 421 ppm | 437 ppm |
| 20-Jun-2023 | 421 ppm | 414 ppm | 417 ppm |
| 19-Jun-2023 | 430 ppm | 418 ppm | 419 ppm |
| 18-Jun-2023 | 436 ppm | 426 ppm | 434 ppm |
| 17-Jun-2023 | 440 ppm | 429 ppm | 437 ppm |
| 16-Jun-2023 | 438 ppm | 421 ppm | 433 ppm |
| 15-Jun-2023 | 433 ppm | 412 ppm | 428 ppm |
| 14-Jun-2023 | 435 ppm | 425 ppm | 438 ppm |
| 13-Jun-2023 | 441 ppm | 436 ppm | 442 ppm |
| 12-Jun-2023 | 442 ppm | 439 ppm | 448ppm |
| 11-Jun-2023 | 443 ppm | 441 ppm | 451 ppm |
| 10-Jun-2023 | 446 ppm | 432 ppm | 4444 ppm |
| 9-Jun-2023 | 441 ppm | 428 ppm | 440ppm |