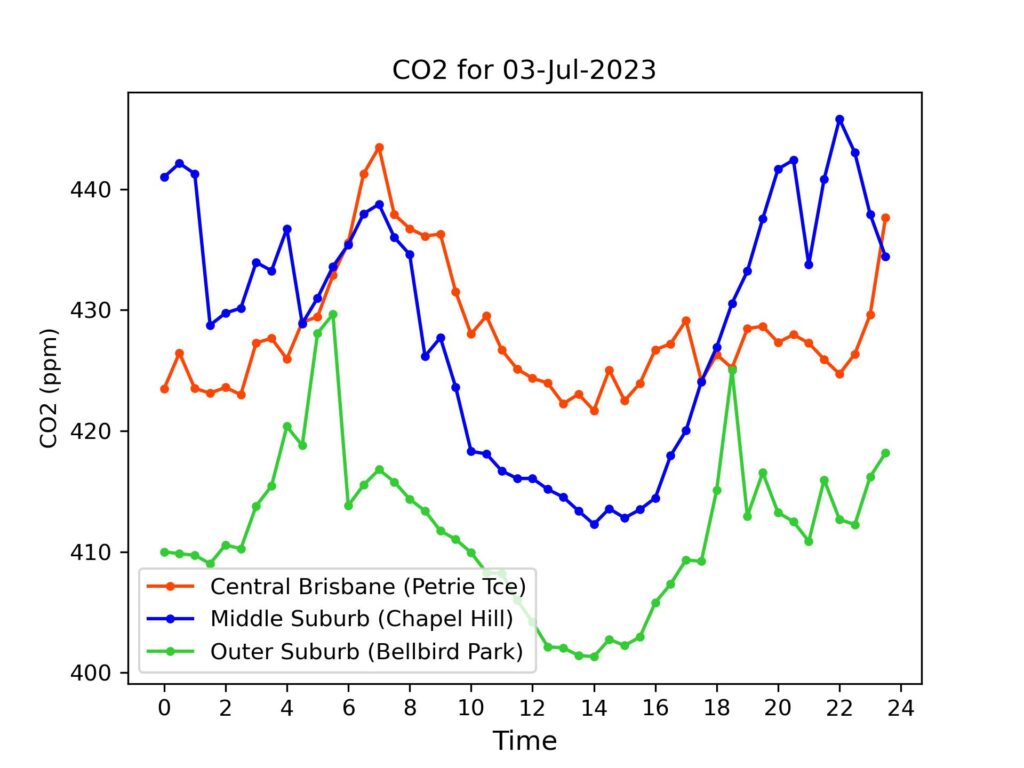
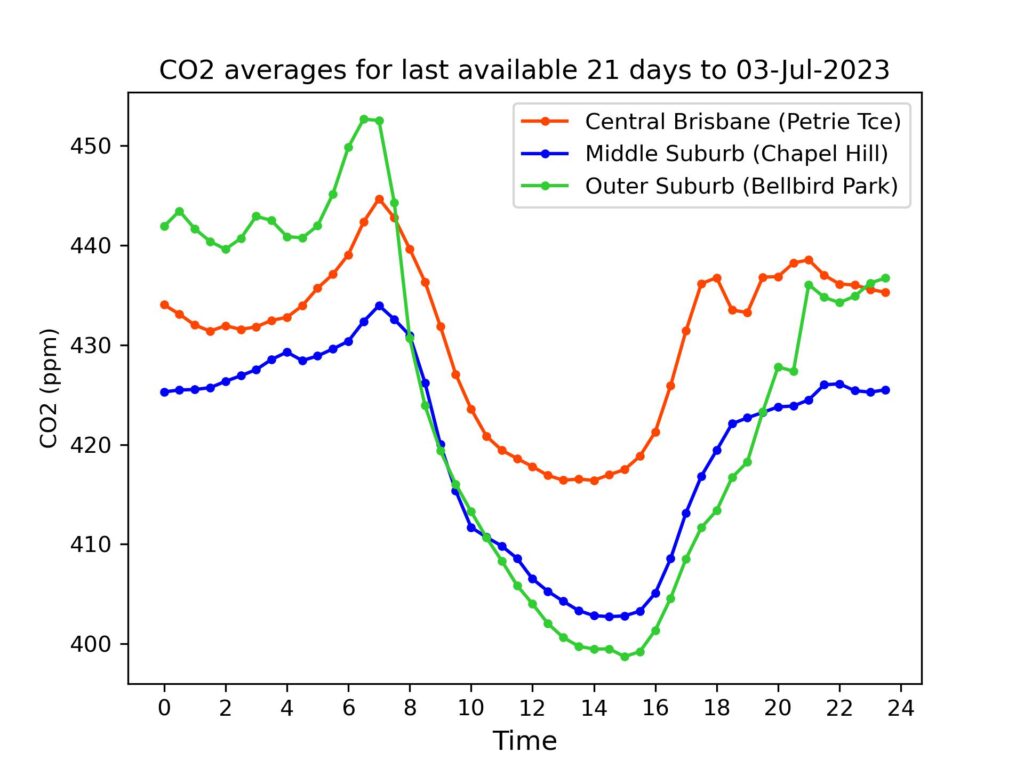
With values slightly higher and winds more southerly, a simple test of the hypothesis of an association between Brisbane’s CO2 concentrations and wind direction seemed in order. Step 1) Calculate the average wind direction from the BOM’s 9am and 3am reports as recorded at Archerfield for each of the last 25 days. Step 2) Calculate the absolute difference between 270 degrees and each of these values. If zero, this number indicates winds from the west, if higher it indicates directions increasingly further away from the west. Step 3), calculate the Pearson correlation between the daily average concentration across our three sensor sites and this value for those 25 days. The result? r = 0.454, p= 0.02. The tentative interpretation of this outcome – very unlikely to be due to chance? Winds from the west tend to bring air with lower carbon dioxide concentrations, winds from other directions tend to bring air across the city, with higher concentrations. This isn’t just because two of our three sensors are towards the west – it’s also that the population distribution of Brisbane leaves a relatively less populated notch towards the west, meaning there is “less city” between even the CBD and the western urban edge than for other directions. A limitation of this analysis is that wind speed isn’t taken into account, and this could exert its own effect by simply pushing anthropogenic emissions out of the city and diluting the concentrations, irrespective of direction. With more data, this factor can also be examined.


Daily Averages – Phase 2 (See explanation of differences between Phase 1 and Phase 2 data)
For reference, latest monthly average (May 2023) from CSIRO for Kennaook/Cape Grim in NW Tasmania was 415.7 ppm. (Note – these are provisional values, subject to revision folllowing sensor re-calibrations and other checks.)
| Date | Petrie Terrace | Chapel Hill | Bellbird Park |
| 3-Jul-2023 | 428 ppm | 429 ppm | 412 ppm |
| 2-Jul-2023 | 424 ppm | 425 ppm | 414 ppm |
| 1-Jul-2023 | 419 ppm | 407 ppm | 405 ppm |
| 30-Jun-2023 | 414 ppm | 405 ppm | 402 ppm |
| 29-Jun-2023 | 415 ppm | 409 ppm | 405 ppm |
| 28-Jun-2023 | 435 ppm | 427 ppm | 428 ppm |
| 27-Jun-2023 | 426 ppm | 409 ppm | 415 ppm |
| 26-Jun-2023 | 412 ppm | 402 ppm | 412 ppm |
| 25-Jun-2023 | 447 ppm | 426 ppm | 429 ppm |
| 24-Jun-2023 | 427 ppm | 417 ppm | 423 ppm |
| 23-Jun-2023 | 434 ppm | 427 ppm | 435 ppm |
| 22-Jun-2023 | 442 ppm | 425 ppm | 436 ppm |
| 21-Jun-2023 | 443 ppm | 421 ppm | 437 ppm |
| 20-Jun-2023 | 421 ppm | 414 ppm | 417 ppm |
| 19-Jun-2023 | 430 ppm | 418 ppm | 419 ppm |
| 18-Jun-2023 | 436 ppm | 426 ppm | 434 ppm |
| 17-Jun-2023 | 440 ppm | 429 ppm | 437 ppm |
| 16-Jun-2023 | 438 ppm | 421 ppm | 433 ppm |
| 15-Jun-2023 | 433 ppm | 412 ppm | 428 ppm |
| 14-Jun-2023 | 435 ppm | 425 ppm | 438 ppm |
| 13-Jun-2023 | 441 ppm | 436 ppm | 442 ppm |
| 12-Jun-2023 | 442 ppm | 439 ppm | 448ppm |
| 11-Jun-2023 | 443 ppm | 441 ppm | 451 ppm |
| 10-Jun-2023 | 446 ppm | 432 ppm | 4444 ppm |
| 9-Jun-2023 | 441 ppm | 428 ppm | 440ppm |
