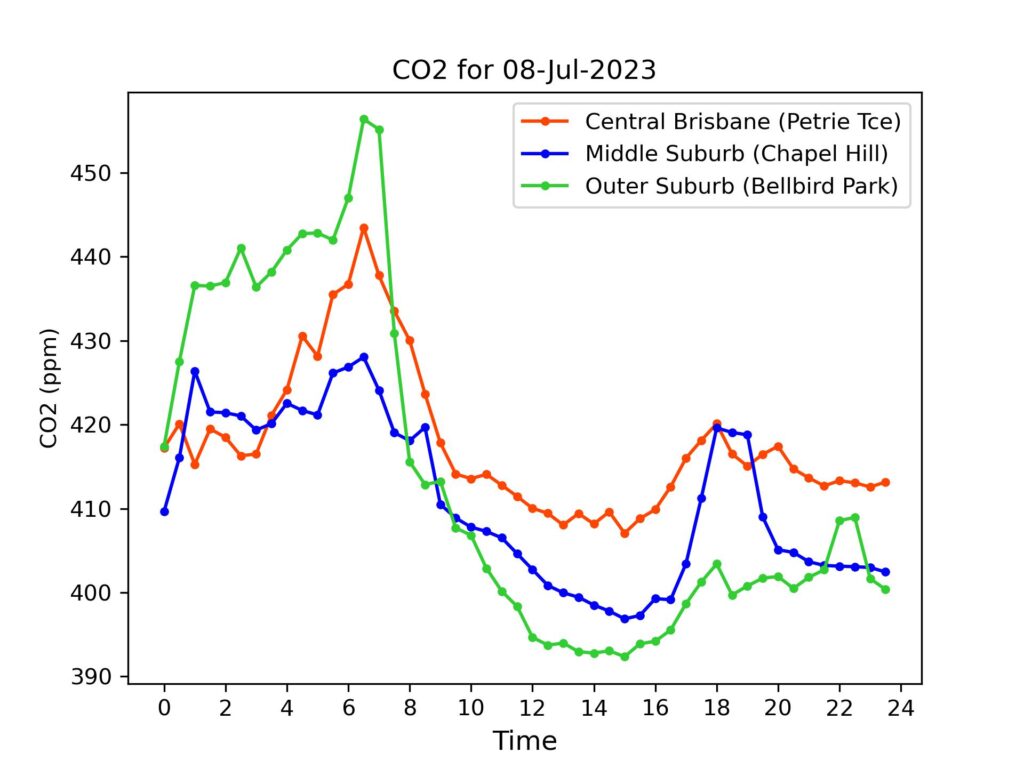
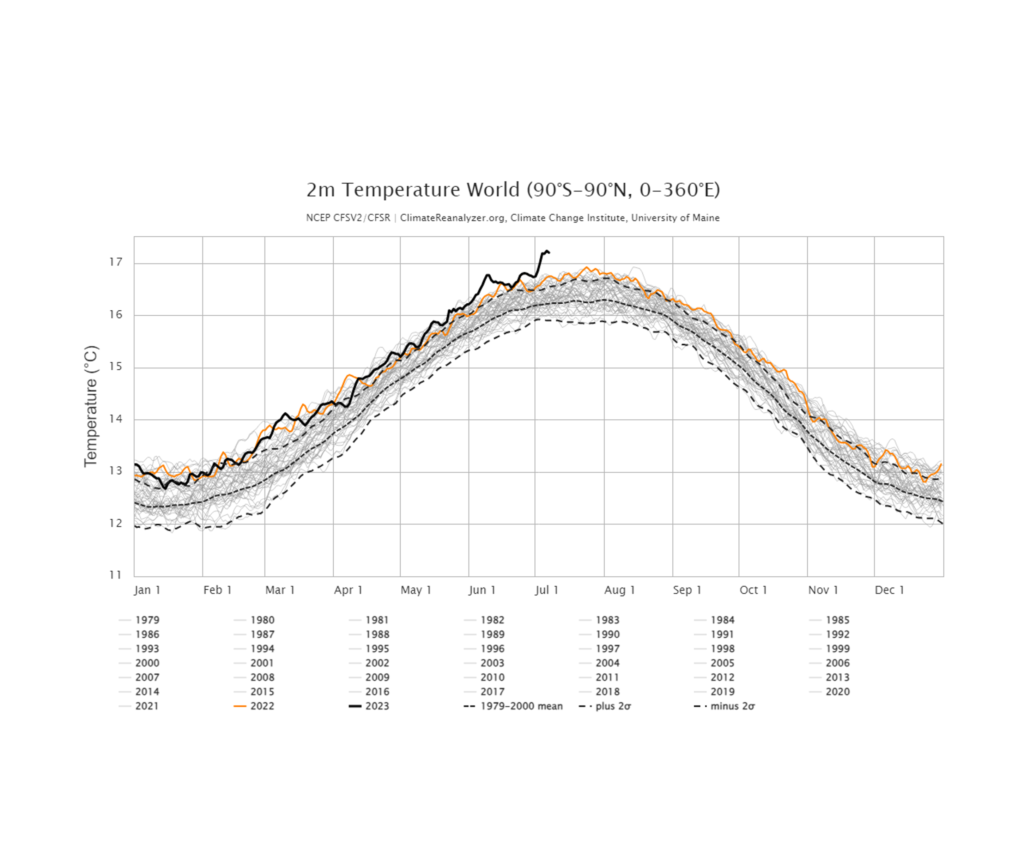
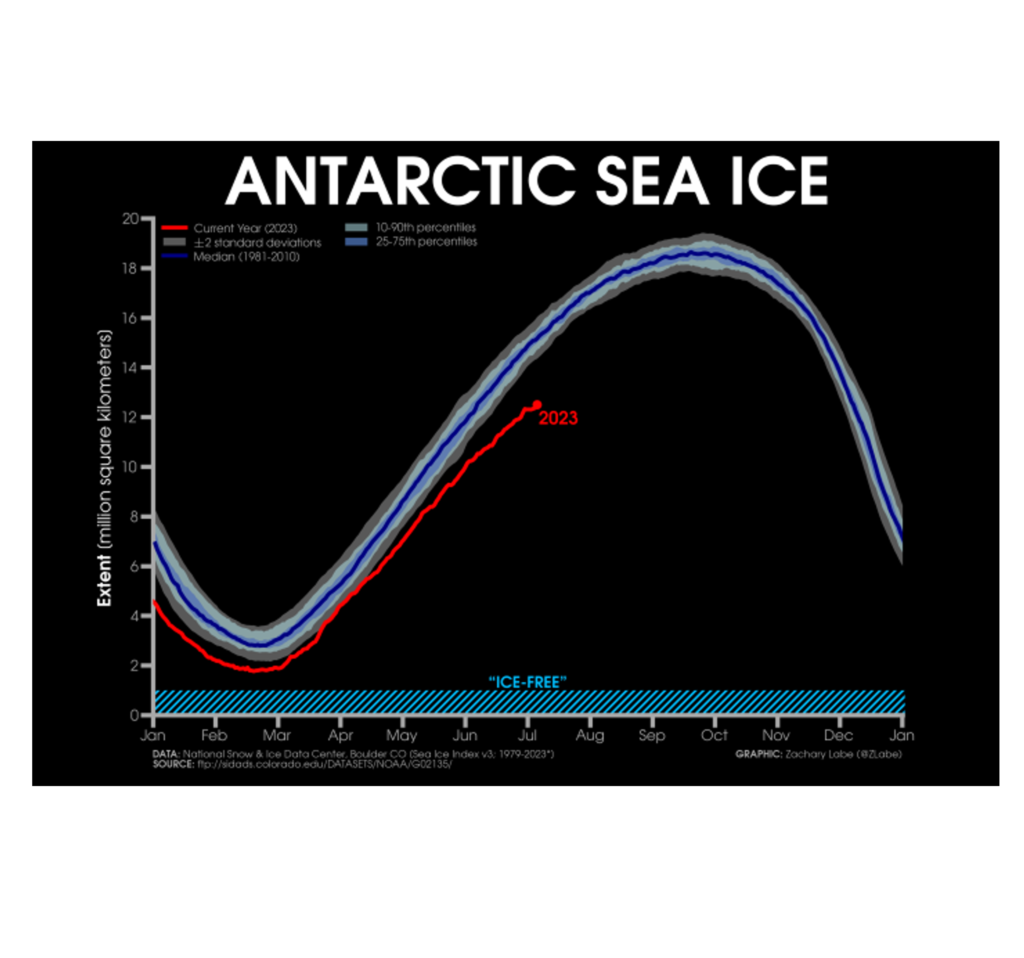
Saturday’s levels were a little higher than Friday’s, but overall they fell over the course of the day. The BoM do not have yesterday’s Archerfield weather summary posted as of the time of writing to relate this to wind speeds and directions. Instead, as a reminder of why tracking carbon dioxide is important, the third image from the University of Maine (dark line) shows the global temperature yesterday – 0.98 degrees C above the mean for the last 4 decades – or in the order of 5 standard deviations above that mean (dashed line is 2 SDs). Brisk mornings in Brisbane this week – but the global average temperature reached its highest ever recorded value not once, but three times in one week. In our hemisphere, Antactic Sea Ice extent was measured this week also at levels multiple standard deviations below its mean – see fourth chart. Anyone who’s had even a basic exposure to statistics will understand the significance of five and six-sigma events. See Zack Labe’s visualisations for this and more information.
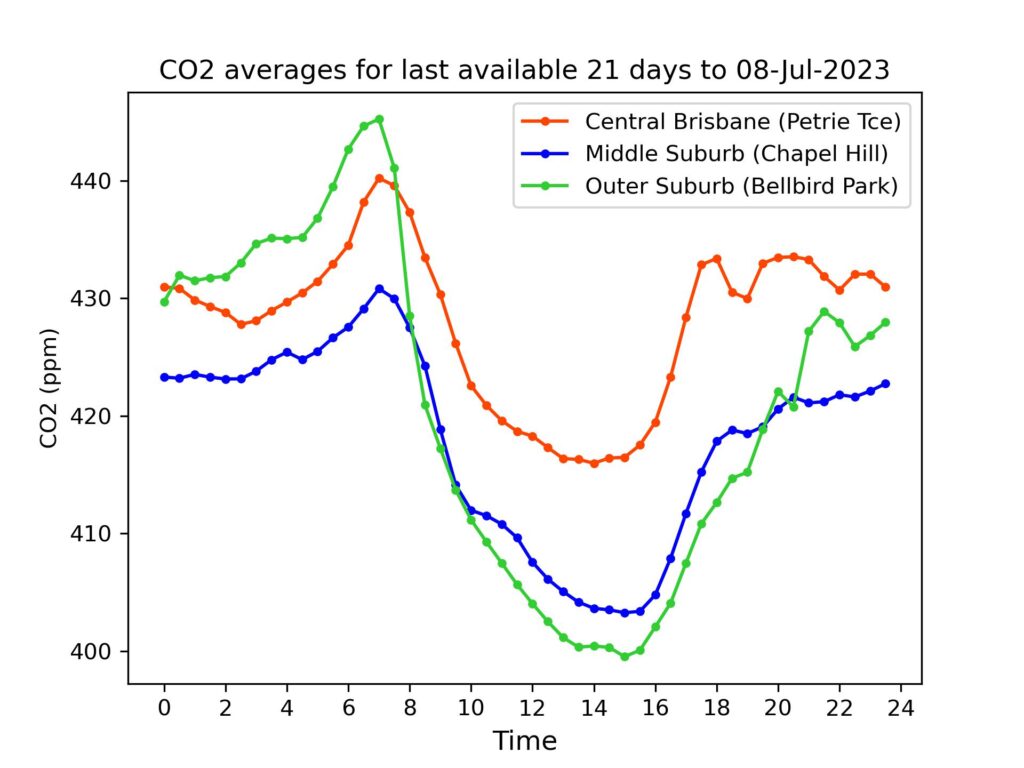
Daily Averages – Phase 2 (See explanation of differences between Phase 1 and Phase 2 data)
For reference, latest monthly average (May 2023) from CSIRO for Kennaook/Cape Grim in NW Tasmania was 415.7 ppm. (Note – these are provisional values, subject to revision folllowing sensor re-calibrations and other checks.)
| Date | Petrie Terrace | Chapel Hill | Bellbird Park |
| 8-Jul-2023 | 418 ppm | 411 ppm | 414 ppm |
| 7-Jul-2023 | 413 ppm | 407 ppm | 408 ppm |
| 6-Jul-2023 | 434 ppm | 427 ppm | 428 ppm |
| 5-Jul-2023 | 442 ppm | 441 ppm | 429 ppm |
| 4-Jul-2023 | 449 ppm | 443 ppm | 429 ppm |
| 3-Jul-2023 | 428 ppm | 429 ppm | 412 ppm |
| 2-Jul-2023 | 424 ppm | 425 ppm | 414 ppm |
| 1-Jul-2023 | 419 ppm | 407 ppm | 405 ppm |
| 30-Jun-2023 | 414 ppm | 405 ppm | 402 ppm |
| 29-Jun-2023 | 415 ppm | 409 ppm | 405 ppm |
| 28-Jun-2023 | 435 ppm | 427 ppm | 428 ppm |
| 27-Jun-2023 | 426 ppm | 409 ppm | 415 ppm |
| 26-Jun-2023 | 412 ppm | 402 ppm | 412 ppm |
| 25-Jun-2023 | 447 ppm | 426 ppm | 429 ppm |
| 24-Jun-2023 | 427 ppm | 417 ppm | 423 ppm |
| 23-Jun-2023 | 434 ppm | 427 ppm | 435 ppm |
| 22-Jun-2023 | 442 ppm | 425 ppm | 436 ppm |
| 21-Jun-2023 | 443 ppm | 421 ppm | 437 ppm |
| 20-Jun-2023 | 421 ppm | 414 ppm | 417 ppm |
| 19-Jun-2023 | 430 ppm | 418 ppm | 419 ppm |
| 18-Jun-2023 | 436 ppm | 426 ppm | 434 ppm |
| 17-Jun-2023 | 440 ppm | 429 ppm | 437 ppm |
| 16-Jun-2023 | 438 ppm | 421 ppm | 433 ppm |
| 15-Jun-2023 | 433 ppm | 412 ppm | 428 ppm |
| 14-Jun-2023 | 435 ppm | 425 ppm | 438 ppm |
| 13-Jun-2023 | 441 ppm | 436 ppm | 442 ppm |
| 12-Jun-2023 | 442 ppm | 439 ppm | 448ppm |
| 11-Jun-2023 | 443 ppm | 441 ppm | 451 ppm |
| 10-Jun-2023 | 446 ppm | 432 ppm | 444 ppm |
| 9-Jun-2023 | 441 ppm | 428 ppm | 440ppm |