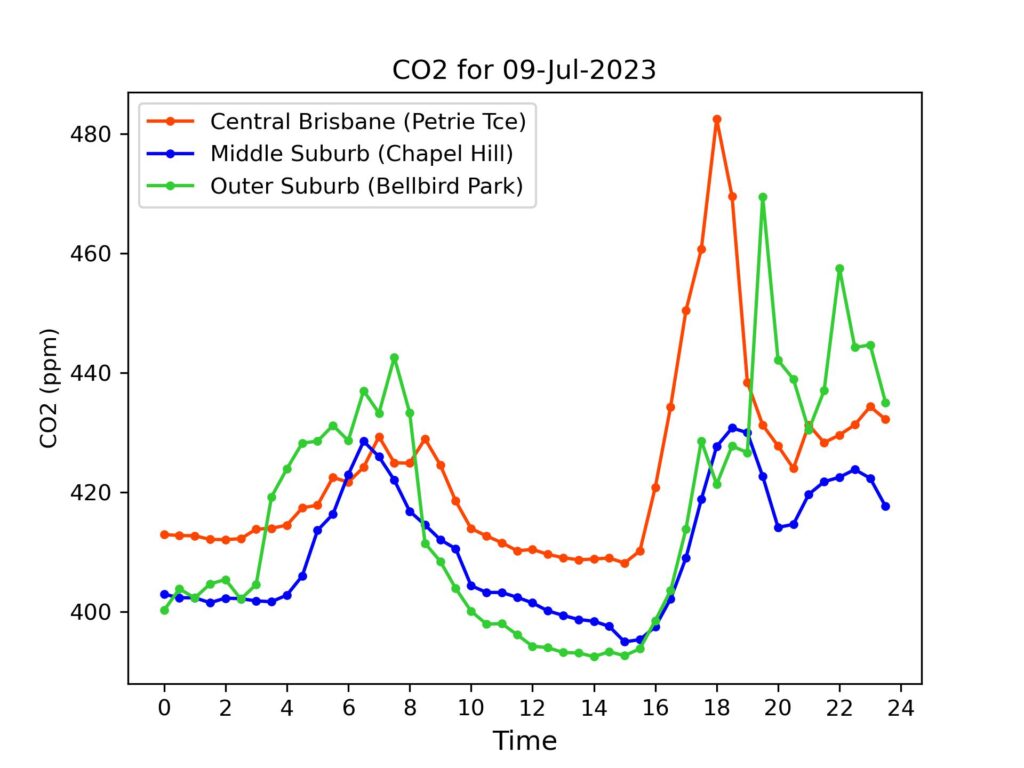
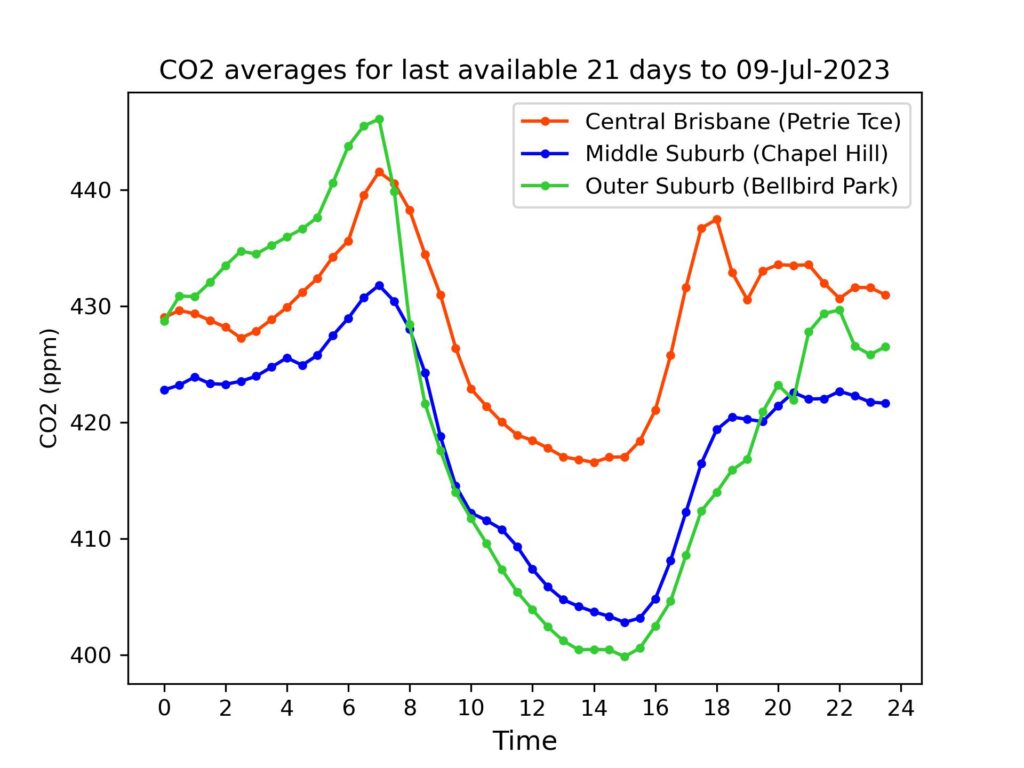
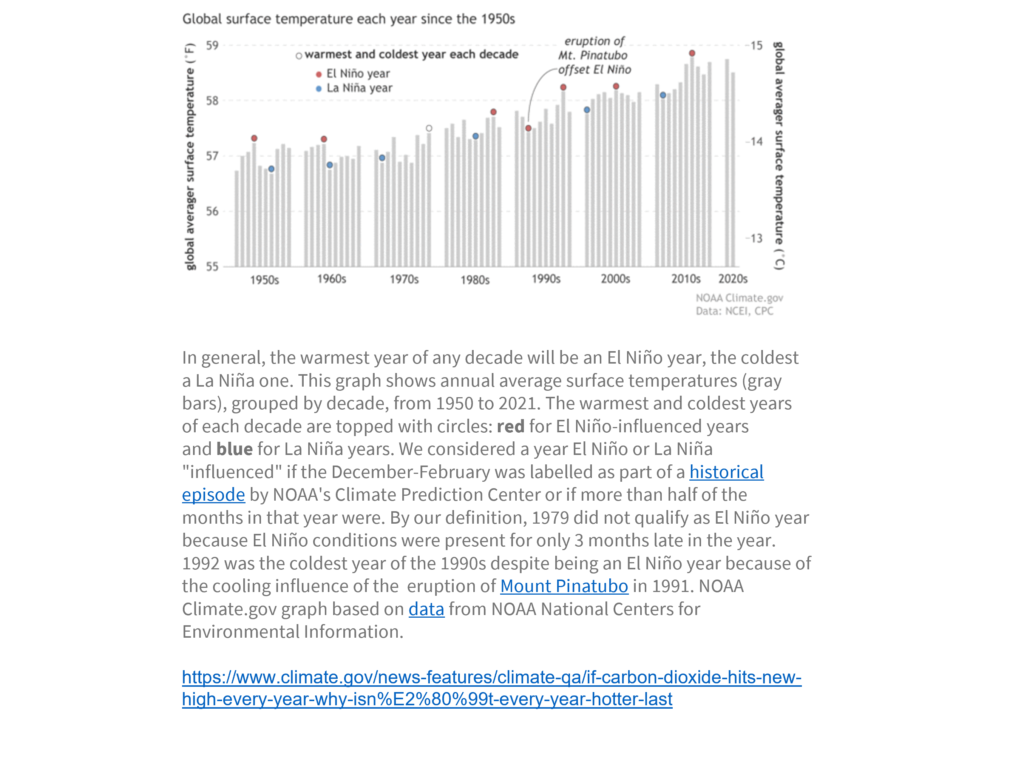
Sunday saw the reverse of Saturday – rising carbon dioxide concentrations across the day. Over the last 31 days, the association between the average daily carbon concentration at our three sites, and the absolute deviation of the wind direction from due west remains moderately strong (r = .44, p = 0.014). In other words, the more the winds are blowing across the city towards the sensors (currently located from the CBD westward) – i.e. from north, east or south, the higher the concentrations tend to be, while westerlies are associated with lower concentrations on average. Today’s third chart is a good explanation of the effects of La Nina and El Nino conditions on global temperatures – a topical issue as we transition from the former to the latter. For more – see the original piece written by NOAA’s Rebecca Lindsey in May this year.
Daily Averages – Phase 2 (See explanation of differences between Phase 1 and Phase 2 data)
For reference, latest monthly average (May 2023) from CSIRO for Kennaook/Cape Grim in NW Tasmania was 415.7 ppm. (Note – these are provisional values, subject to revision folllowing sensor re-calibrations and other checks.)
| Date | Petrie Terrace | Chapel Hill | Bellbird Park |
| 9-Jul-2023 | 423 ppm | 411 ppm | 417 ppm |
| 8-Jul-2023 | 418 ppm | 411 ppm | 414 ppm |
| 7-Jul-2023 | 413 ppm | 407 ppm | 408 ppm |
| 6-Jul-2023 | 434 ppm | 427 ppm | 428 ppm |
| 5-Jul-2023 | 442 ppm | 441 ppm | 429 ppm |
| 4-Jul-2023 | 449 ppm | 443 ppm | 429 ppm |
| 3-Jul-2023 | 428 ppm | 429 ppm | 412 ppm |
| 2-Jul-2023 | 424 ppm | 425 ppm | 414 ppm |
| 1-Jul-2023 | 419 ppm | 407 ppm | 405 ppm |
| 30-Jun-2023 | 414 ppm | 405 ppm | 402 ppm |
| 29-Jun-2023 | 415 ppm | 409 ppm | 405 ppm |
| 28-Jun-2023 | 435 ppm | 427 ppm | 428 ppm |
| 27-Jun-2023 | 426 ppm | 409 ppm | 415 ppm |
| 26-Jun-2023 | 412 ppm | 402 ppm | 412 ppm |
| 25-Jun-2023 | 447 ppm | 426 ppm | 429 ppm |
| 24-Jun-2023 | 427 ppm | 417 ppm | 423 ppm |
| 23-Jun-2023 | 434 ppm | 427 ppm | 435 ppm |
| 22-Jun-2023 | 442 ppm | 425 ppm | 436 ppm |
| 21-Jun-2023 | 443 ppm | 421 ppm | 437 ppm |
| 20-Jun-2023 | 421 ppm | 414 ppm | 417 ppm |
| 19-Jun-2023 | 430 ppm | 418 ppm | 419 ppm |
| 18-Jun-2023 | 436 ppm | 426 ppm | 434 ppm |
| 17-Jun-2023 | 440 ppm | 429 ppm | 437 ppm |
| 16-Jun-2023 | 438 ppm | 421 ppm | 433 ppm |
| 15-Jun-2023 | 433 ppm | 412 ppm | 428 ppm |
| 14-Jun-2023 | 435 ppm | 425 ppm | 438 ppm |
| 13-Jun-2023 | 441 ppm | 436 ppm | 442 ppm |
| 12-Jun-2023 | 442 ppm | 439 ppm | 448ppm |
| 11-Jun-2023 | 443 ppm | 441 ppm | 451 ppm |
| 10-Jun-2023 | 446 ppm | 432 ppm | 444 ppm |
| 9-Jun-2023 | 441 ppm | 428 ppm | 440ppm |