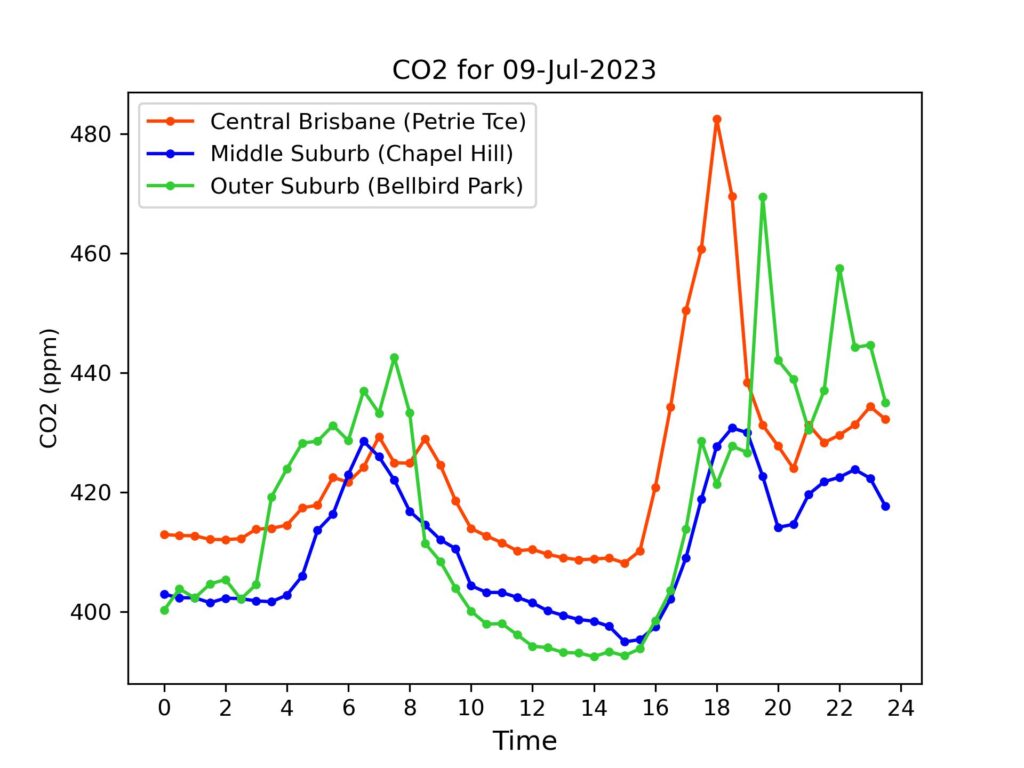
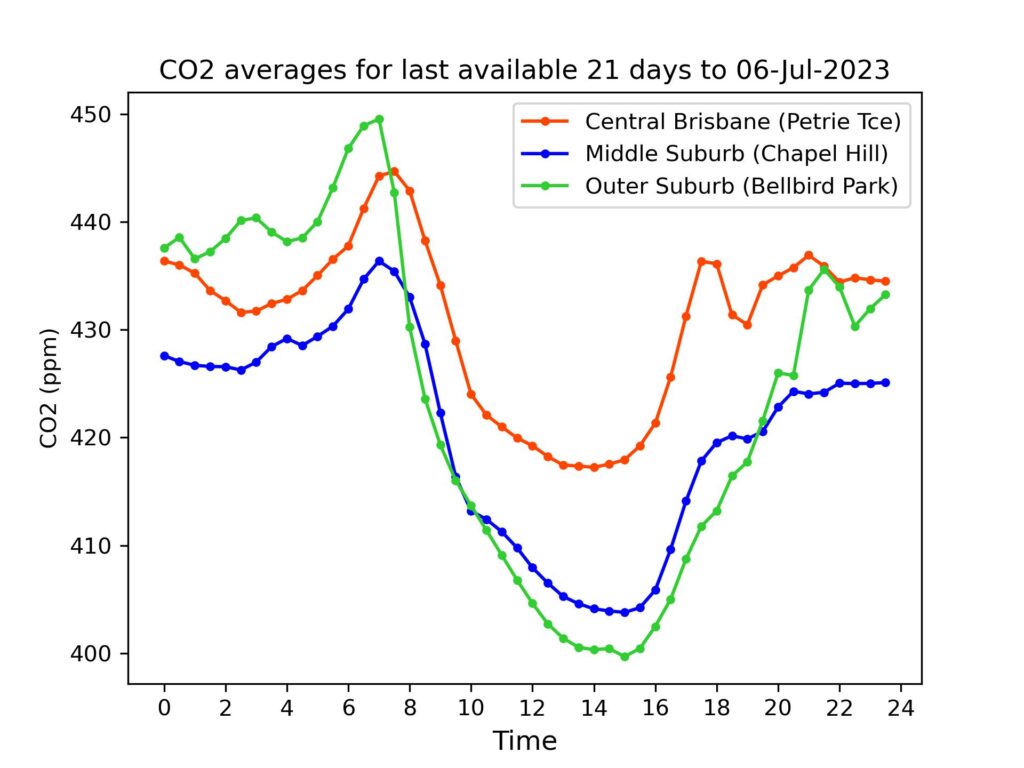
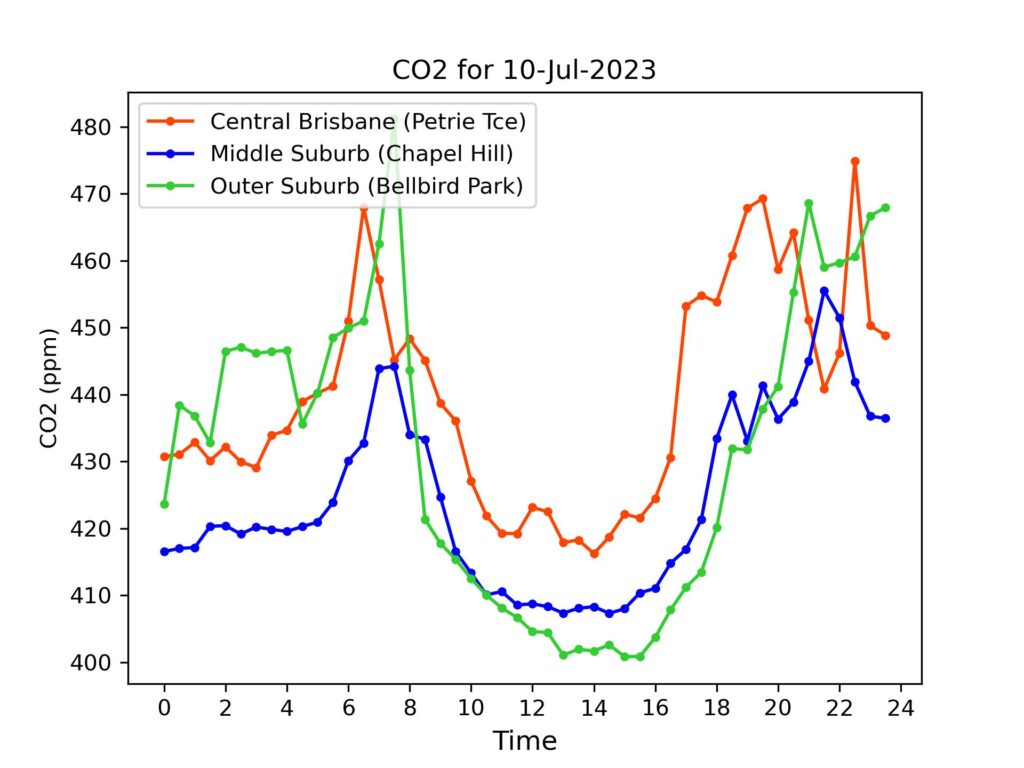
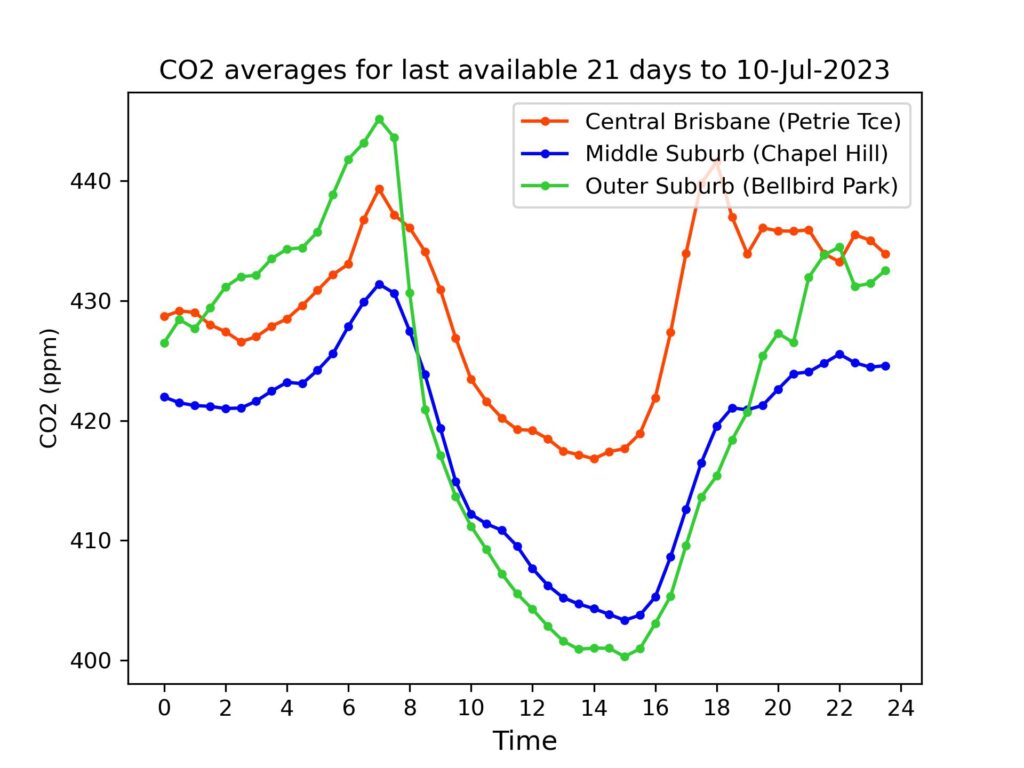
Brisbane CO2 for 10 July 2023
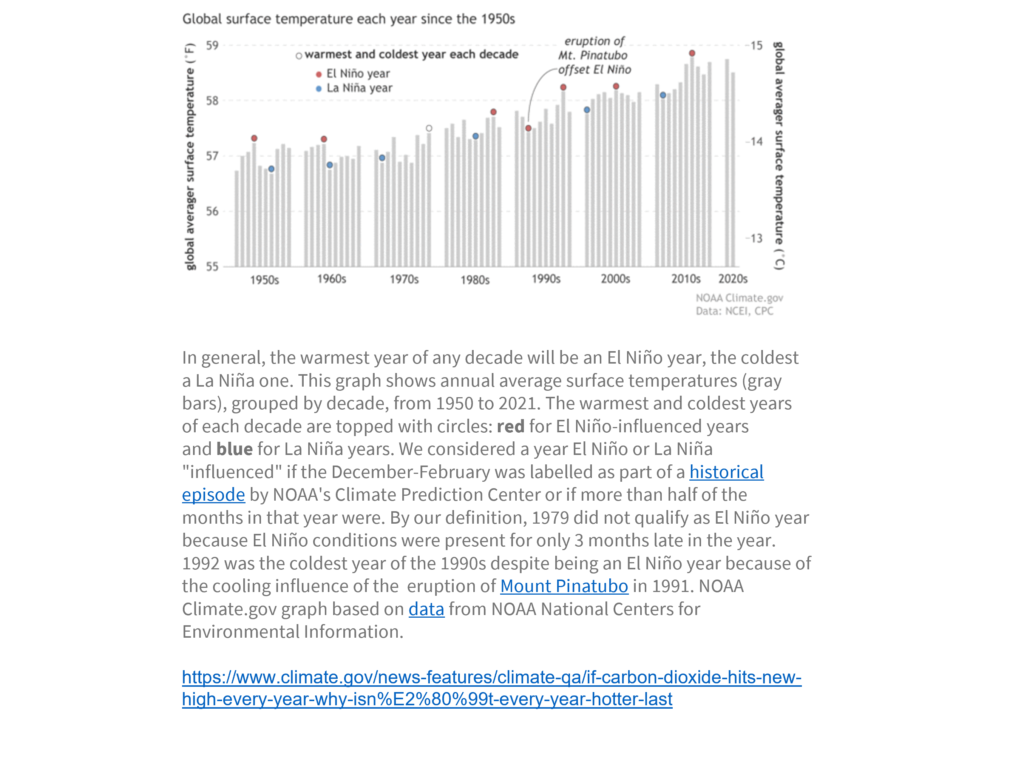
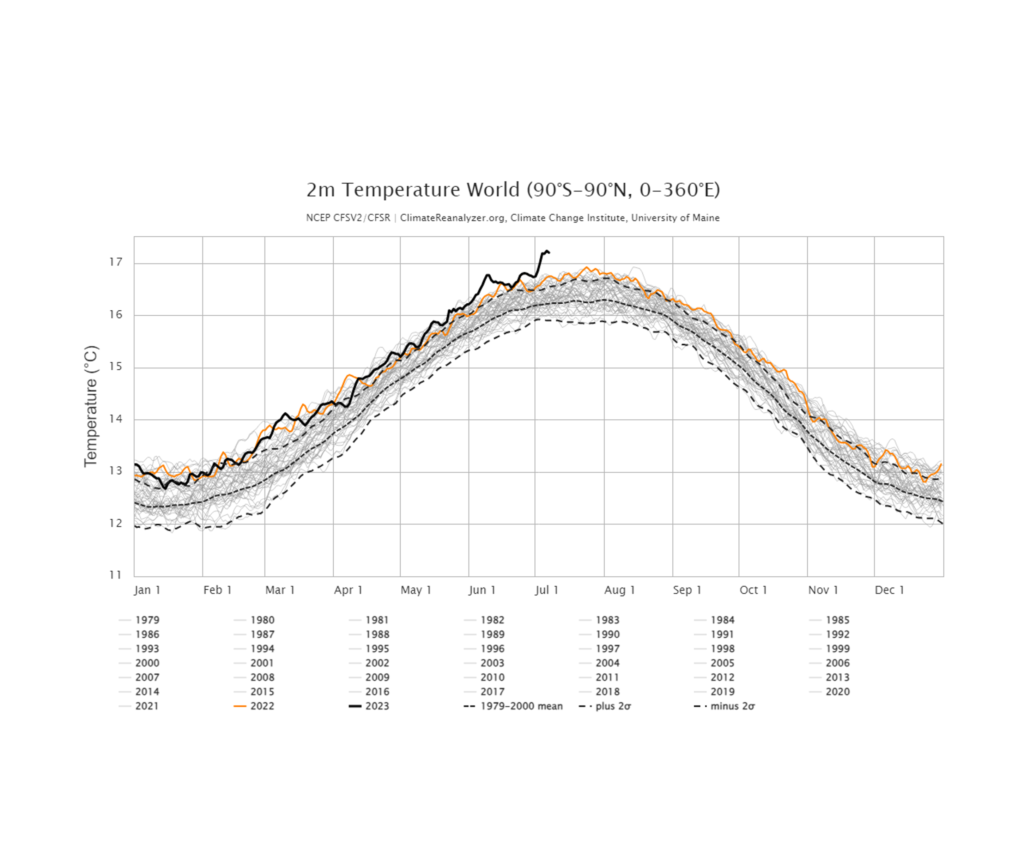
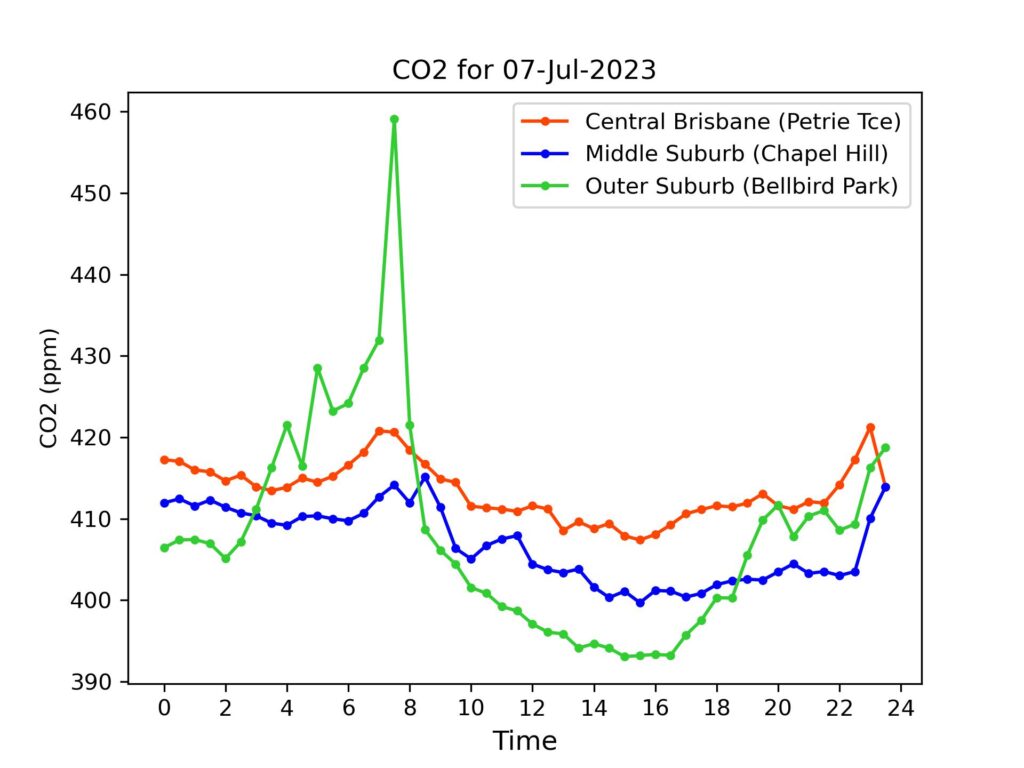
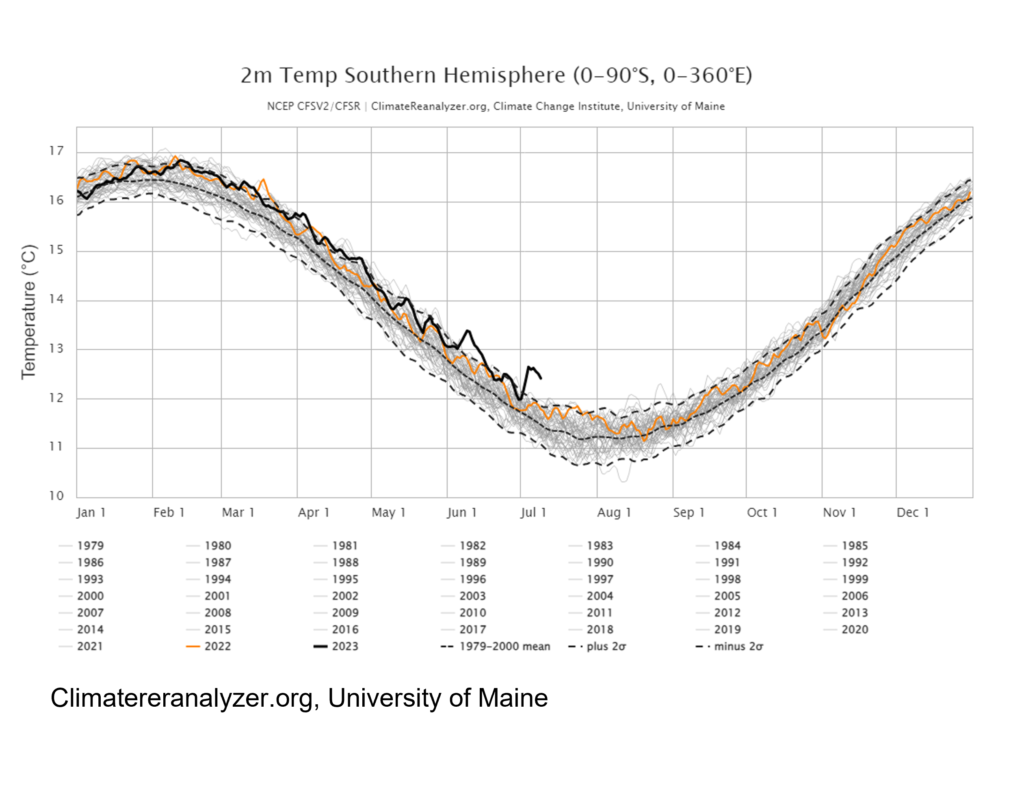
Carbon dioxide concentrations rose at all three sites on Monday – by 16, 13 and 15 ppm from Sunday, at the CBD (Petrie Terrace), middle suburb (Chapel Hill) and city edge (Bellbird Park (sites). All three sites exceeded 450 ppm on average for at least one 30 minute period. Winds were from the SW at 6 km/h at 9 a.m. and from the NNW at 15 km/h at 3 pm (recorded by the BoM at Archerfield), so a little calmer than in recent days and not straight from the west, which may have allowed more CO2 to accumulate. Another factor on Monday may have been additional emissions associated with school traffic resuming after the break. Today’s final chart reinforces the point that southern hemisphere seasonal low temperatures are increasing along with northern hemisphere highs. On several days in the last week (data is up to Sunday), The University of Maine’s estimates put the southern hemisphere at about or more than 1 full degree C above the mean for the last four decades – a level almost 4 standard deviations above that mean.
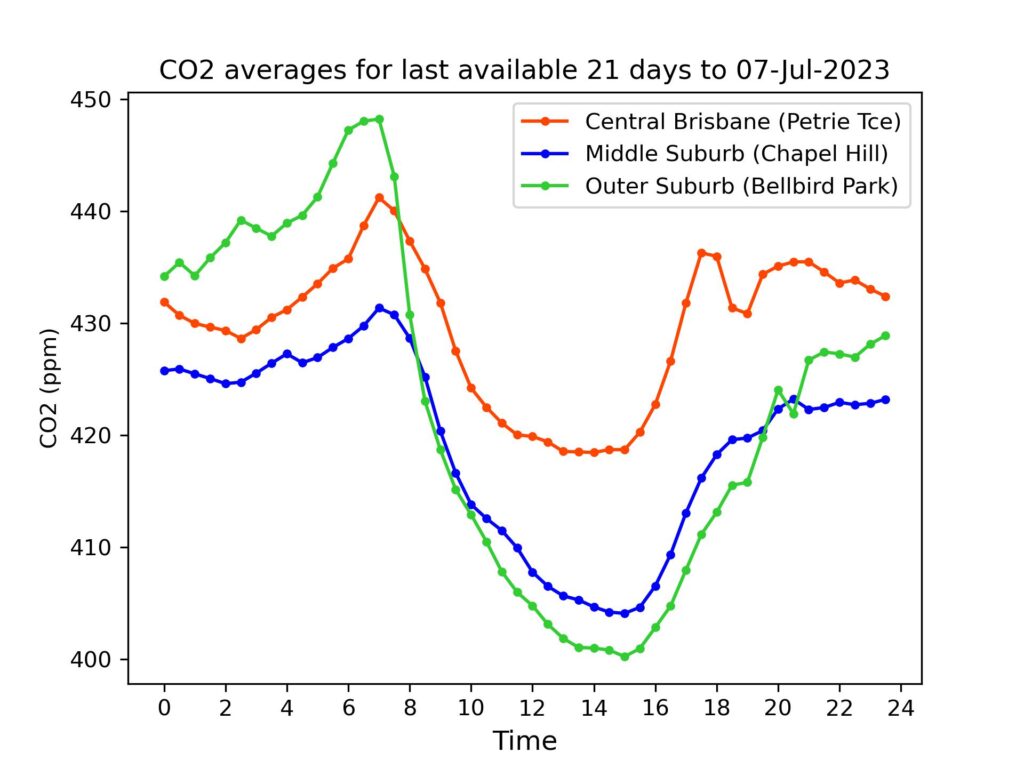
Daily Averages – Phase 2 (See explanation of differences between Phase 1 and Phase 2 data)
For reference, latest monthly average (May 2023) from CSIRO for Kennaook/Cape Grim in NW Tasmania was 415.7 ppm. (Note – these are provisional values, subject to revision folllowing sensor re-calibrations and other checks.)
| Date | Petrie Terrace | Chapel Hill | Bellbird Park |
| 10-Jul-2023 | 439 ppm | 424 ppm | 432 ppm |
| 9-Jul-2023 | 423 ppm | 411 ppm | 417 ppm |
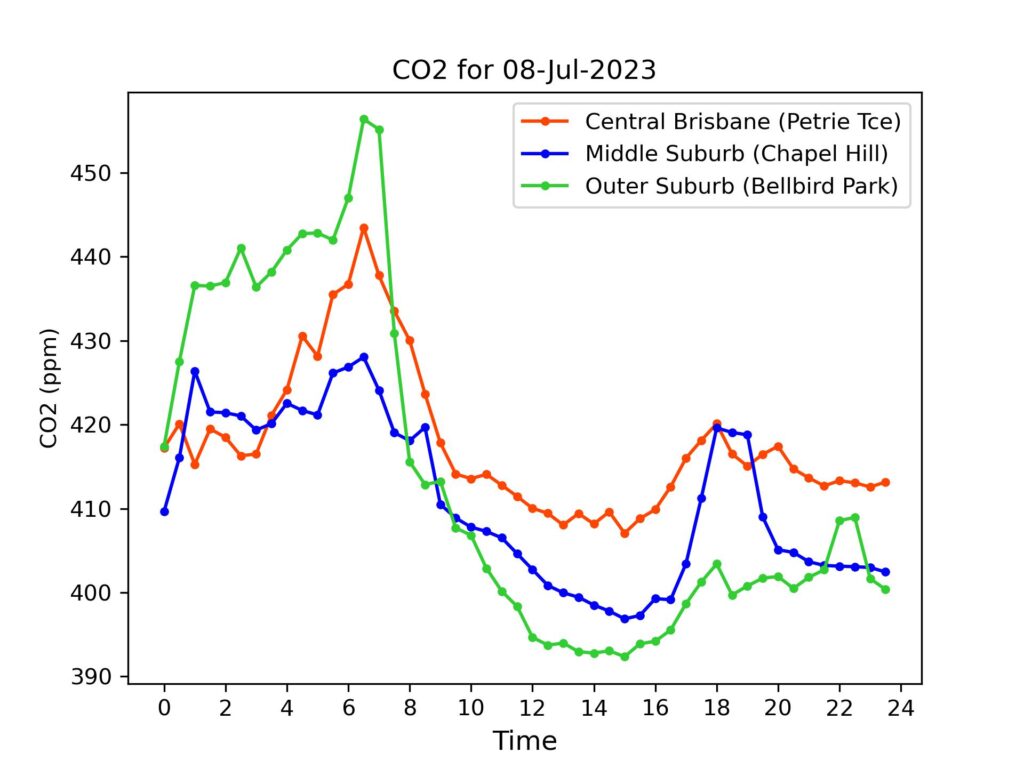
| 8-Jul-2023 | 418 ppm | 411 ppm | 414 ppm |
| 7-Jul-2023 | 413 ppm | 407 ppm | 408 ppm |
| 6-Jul-2023 | 434 ppm | 427 ppm | 428 ppm |
| 5-Jul-2023 | 442 ppm | 441 ppm | 429 ppm |
| 4-Jul-2023 | 449 ppm | 443 ppm | 429 ppm |
| 3-Jul-2023 | 428 ppm | 429 ppm | 412 ppm |
| 2-Jul-2023 | 424 ppm | 425 ppm | 414 ppm |
| 1-Jul-2023 | 419 ppm | 407 ppm | 405 ppm |
| 30-Jun-2023 | 414 ppm | 405 ppm | 402 ppm |
| 29-Jun-2023 | 415 ppm | 409 ppm | 405 ppm |
| 28-Jun-2023 | 435 ppm | 427 ppm | 428 ppm |
| 27-Jun-2023 | 426 ppm | 409 ppm | 415 ppm |
| 26-Jun-2023 | 412 ppm | 402 ppm | 412 ppm |
| 25-Jun-2023 | 447 ppm | 426 ppm | 429 ppm |
| 24-Jun-2023 | 427 ppm | 417 ppm | 423 ppm |
| 23-Jun-2023 | 434 ppm | 427 ppm | 435 ppm |
| 22-Jun-2023 | 442 ppm | 425 ppm | 436 ppm |
| 21-Jun-2023 | 443 ppm | 421 ppm | 437 ppm |
| 20-Jun-2023 | 421 ppm | 414 ppm | 417 ppm |
| 19-Jun-2023 | 430 ppm | 418 ppm | 419 ppm |
| 18-Jun-2023 | 436 ppm | 426 ppm | 434 ppm |
| 17-Jun-2023 | 440 ppm | 429 ppm | 437 ppm |
| 16-Jun-2023 | 438 ppm | 421 ppm | 433 ppm |
| 15-Jun-2023 | 433 ppm | 412 ppm | 428 ppm |
| 14-Jun-2023 | 435 ppm | 425 ppm | 438 ppm |
| 13-Jun-2023 | 441 ppm | 436 ppm | 442 ppm |
| 12-Jun-2023 | 442 ppm | 439 ppm | 448ppm |
| 11-Jun-2023 | 443 ppm | 441 ppm | 451 ppm |
| 10-Jun-2023 | 446 ppm | 432 ppm | 444 ppm |
| 9-Jun-2023 | 441 ppm | 428 ppm | 440ppm |
Brisbane CO2 for 10 July 2023 Read More »