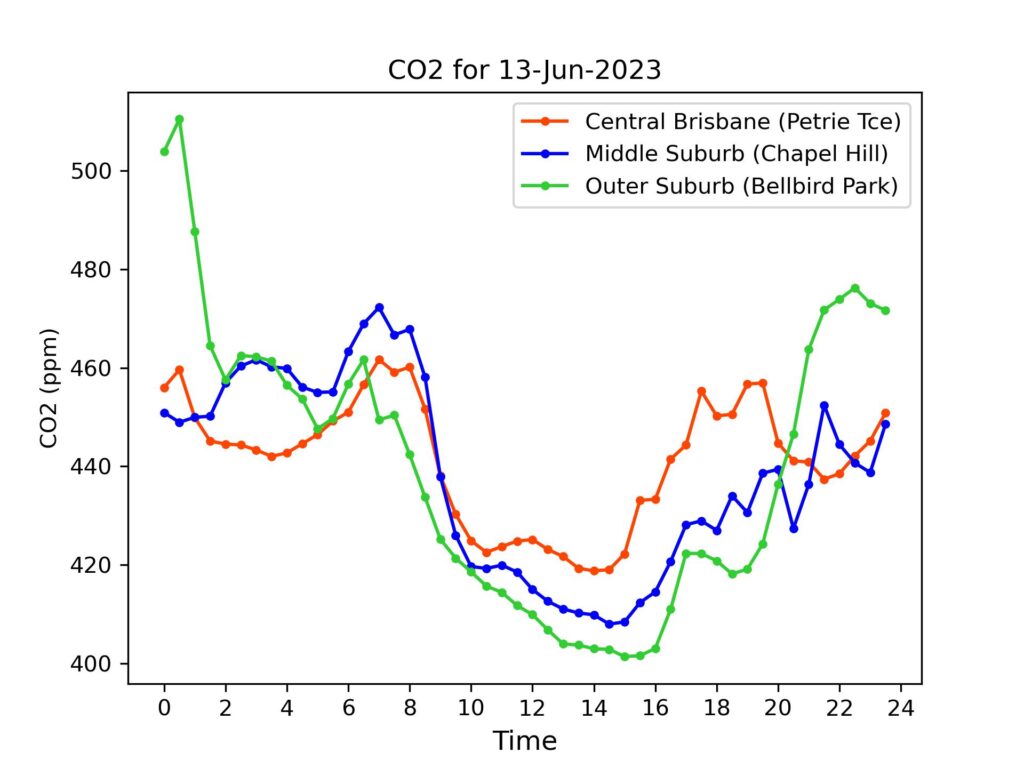
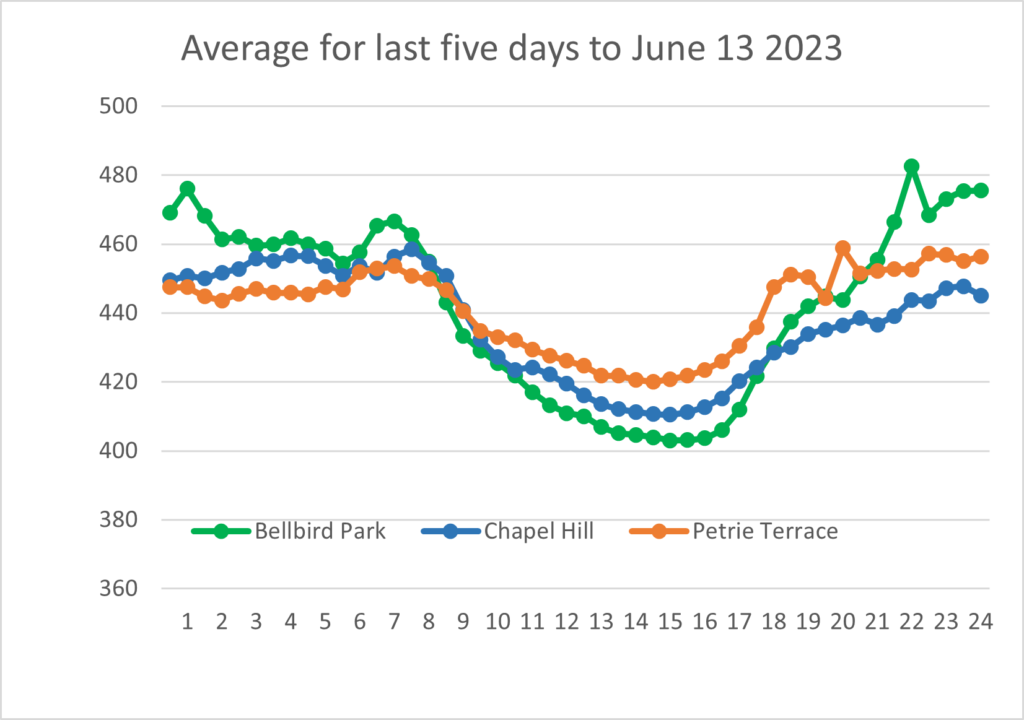
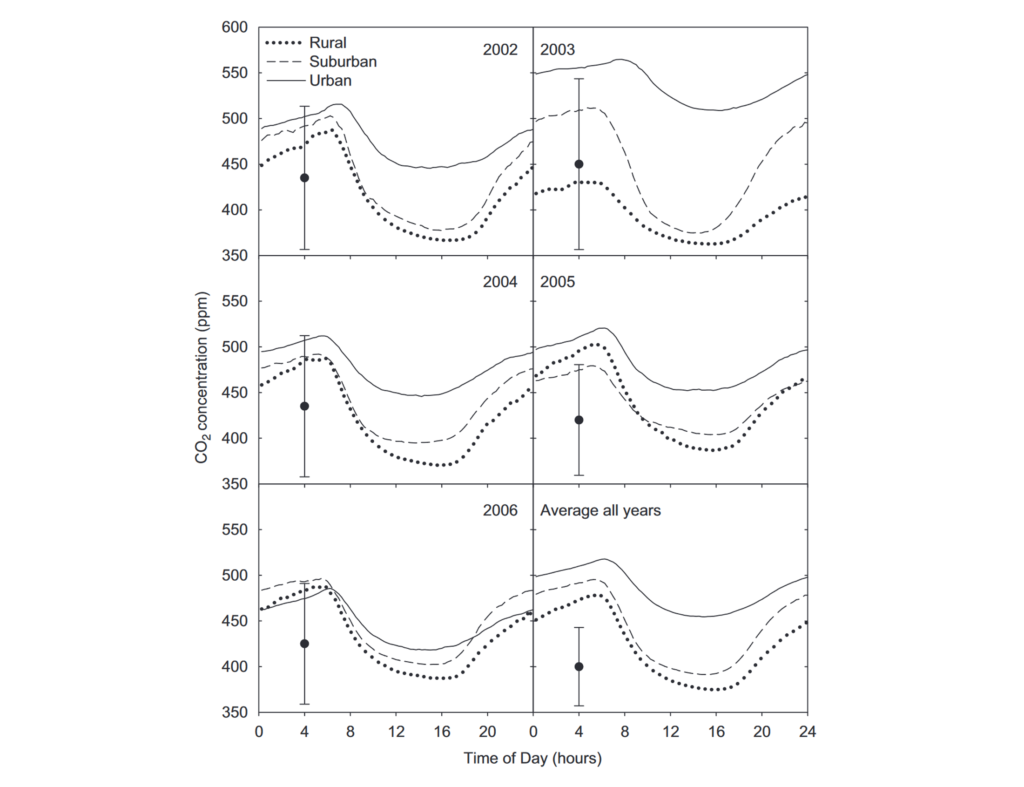
Five days into Phase 2 data (see explanation here) and the tendency for the city edge site (Bellbird Park) to have high nighttime values continues. (A temporary glitch in the code for averaging across days means resorting to Excel for the second graph, hence the different format.) Why does the CBD site have a smaller range (max for day – min for day) than the other sites? Over the last five days, this range averages 39 ppm in the CBD, 48 ppm in the middle suburb, and 80 ppm on the city edge. One possibility is that there are smaller effects of photosynthesis (CO2 absorbing in daylight) and respiration (CO2 emitting in darkness) in the CBD. The third graph shows a similar smaller range for an urban site (downtown Baltimore) over five years than for a suburban or rural site. George, K., L. H. Ziska, J. A. Bunce, and B. Quebedeaux. ‘Elevated Atmospheric CO2 Concentration and Temperature across an Urban–Rural Transect’. Atmospheric Environment 41, no. 35 (1 November 2007): 7654–65. https://doi.org/10.1016/j.atmosenv.2007.08.018. This explanation can be tested as we add more monitors to the network.
Daily Averages – Phase 2 (See explanation of differences between Phase 1 and Phase 2 data)
For reference, latest monthly average (Apr 2023) from CSIRO for Kennaook/Cape Grim in NW Tasmania was 415.4 ppm. (Note – these are provisional values, subject to revision folllowing sensor re-calibrations and other checks.)
| Date | Petrie Terrace | Chapel Hill | Bellbird Park |
| 13-Jun-2023 | 441 ppm | 438 ppm | 440 ppm |
| 12-Jun-2023 | 442 ppm | 441 ppm | 446ppm |
| 11-Jun-2023 | 443 ppm | 443 ppm | 449 ppm |
| 10-Jun-2023 | 446 ppm | 434 ppm | 442 ppm |
| 9-Jun-2023 | 440 ppm | 430 ppm | 438 ppm |