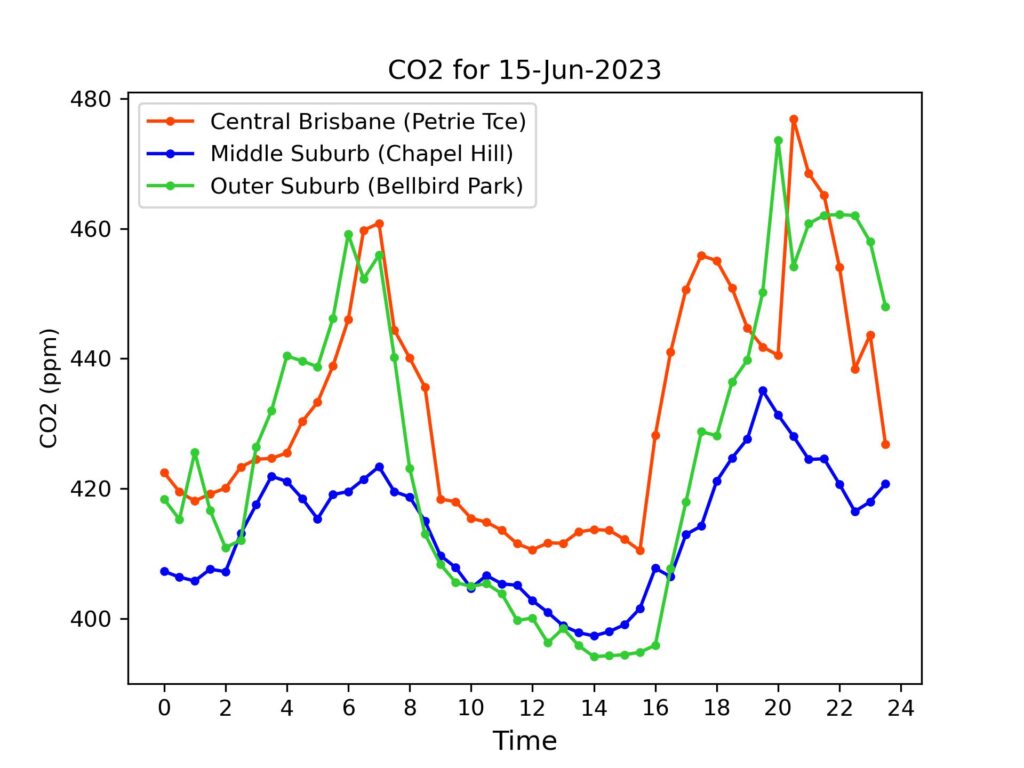
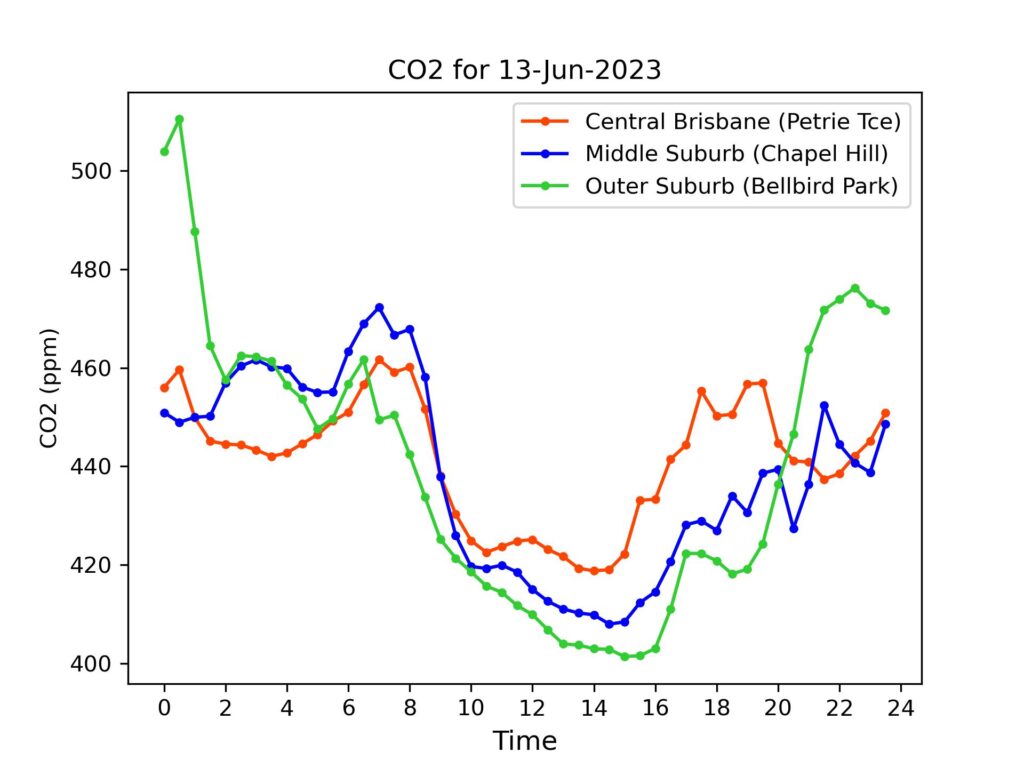
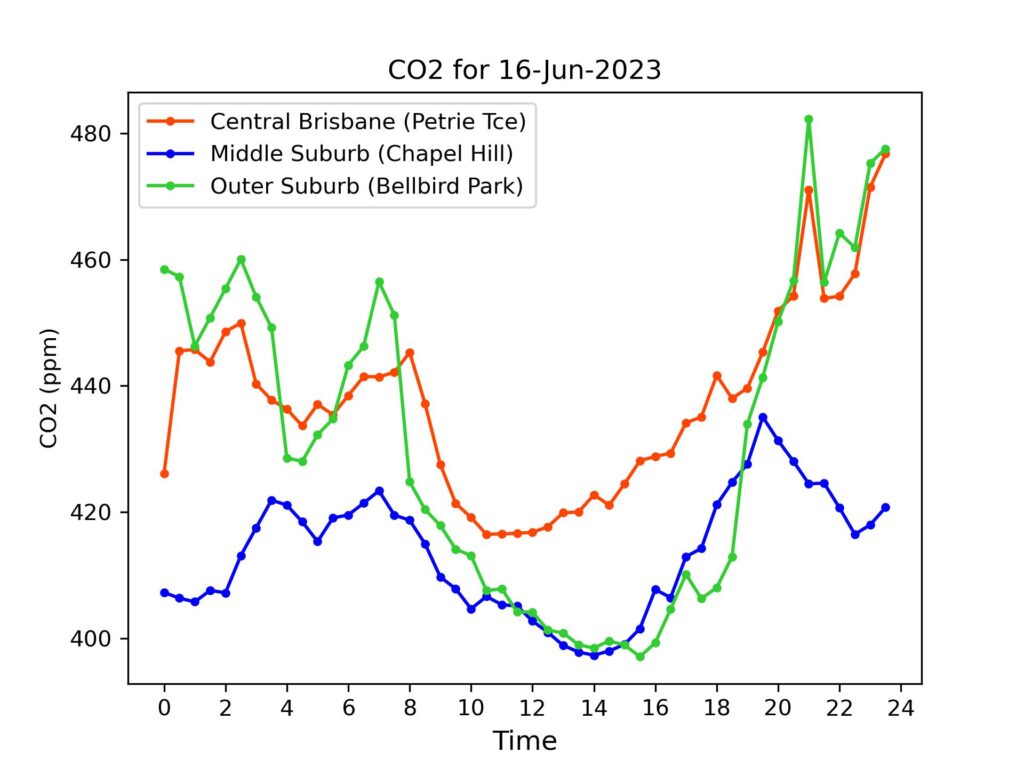
Brisbane CO2 for 16 June 2023
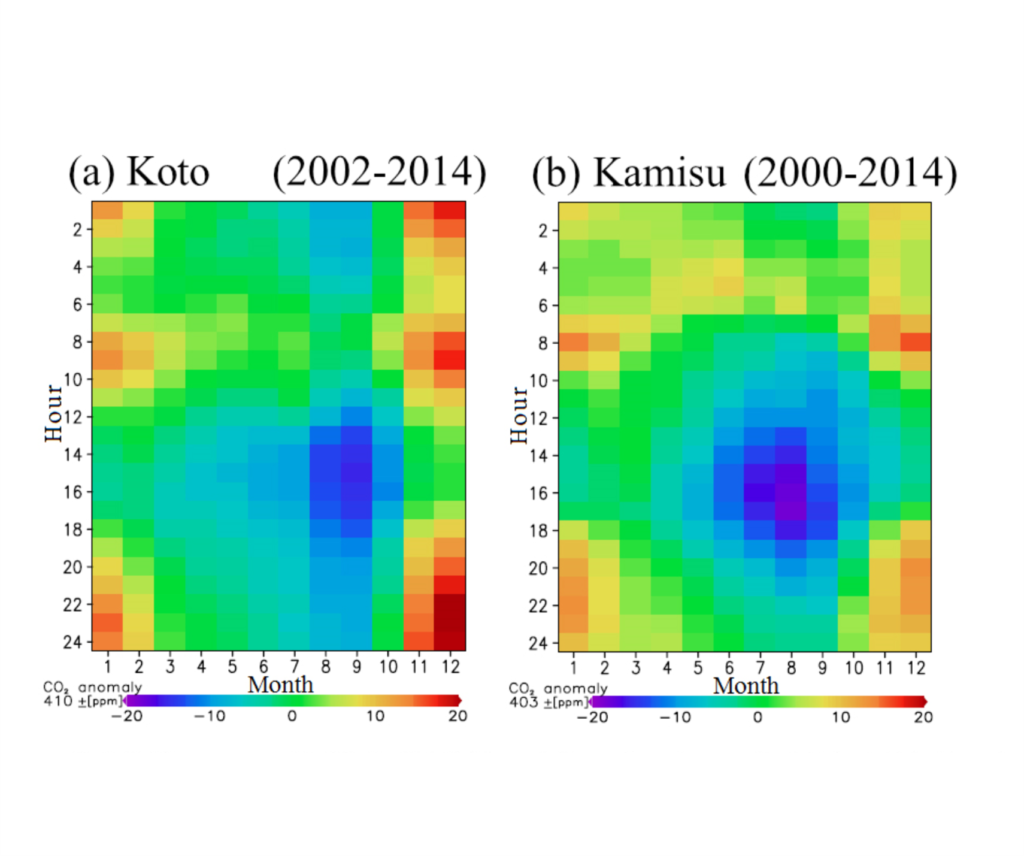
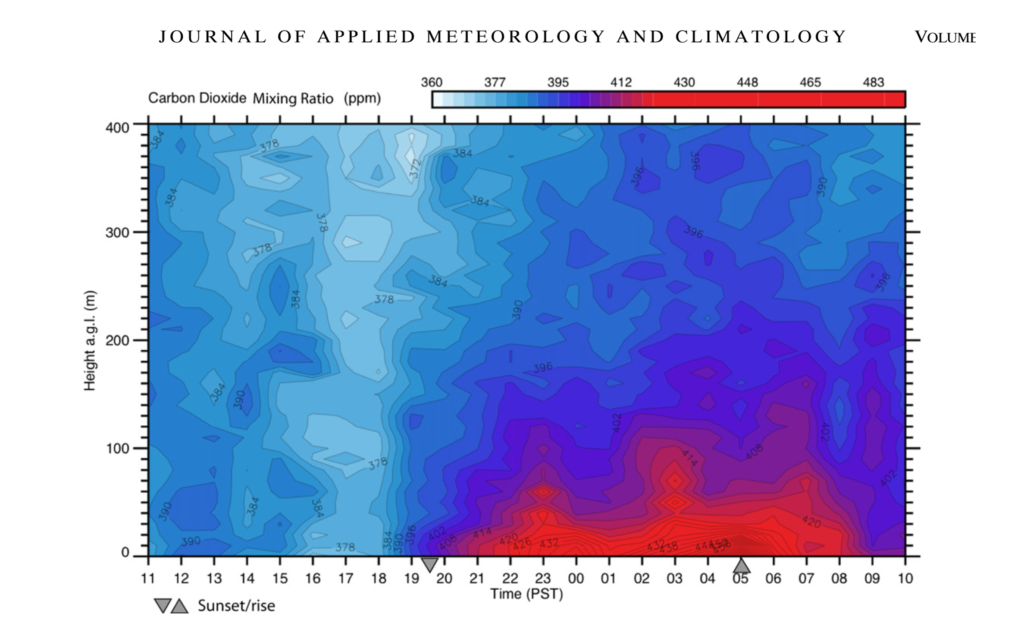
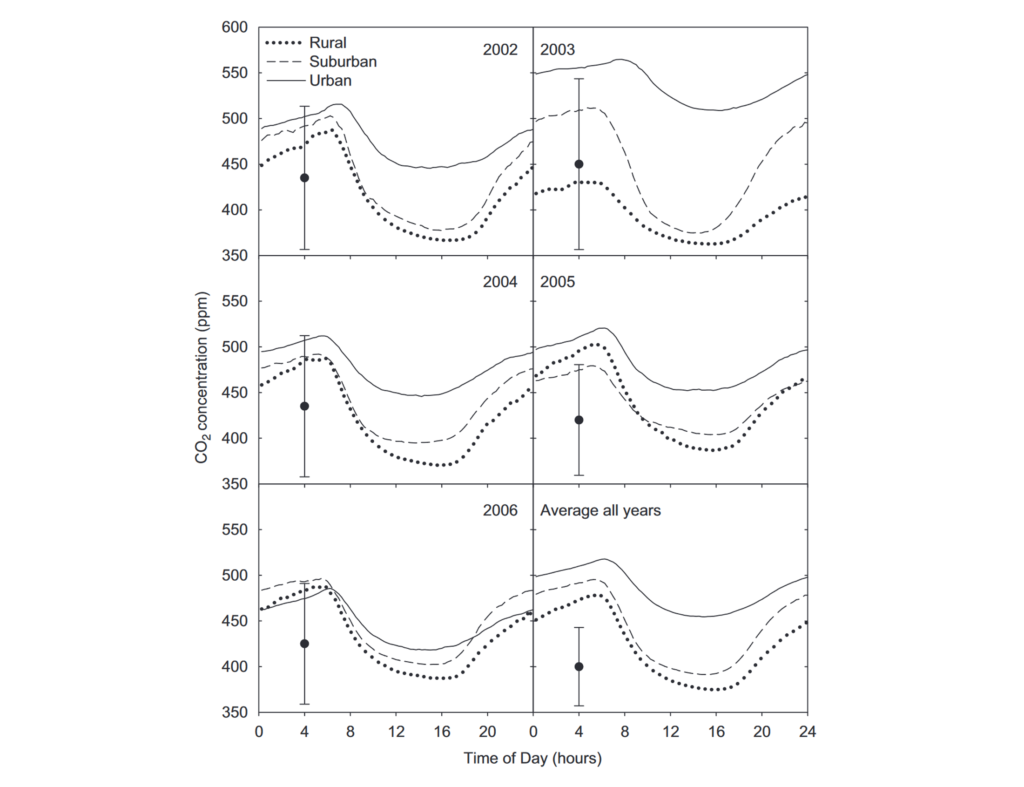
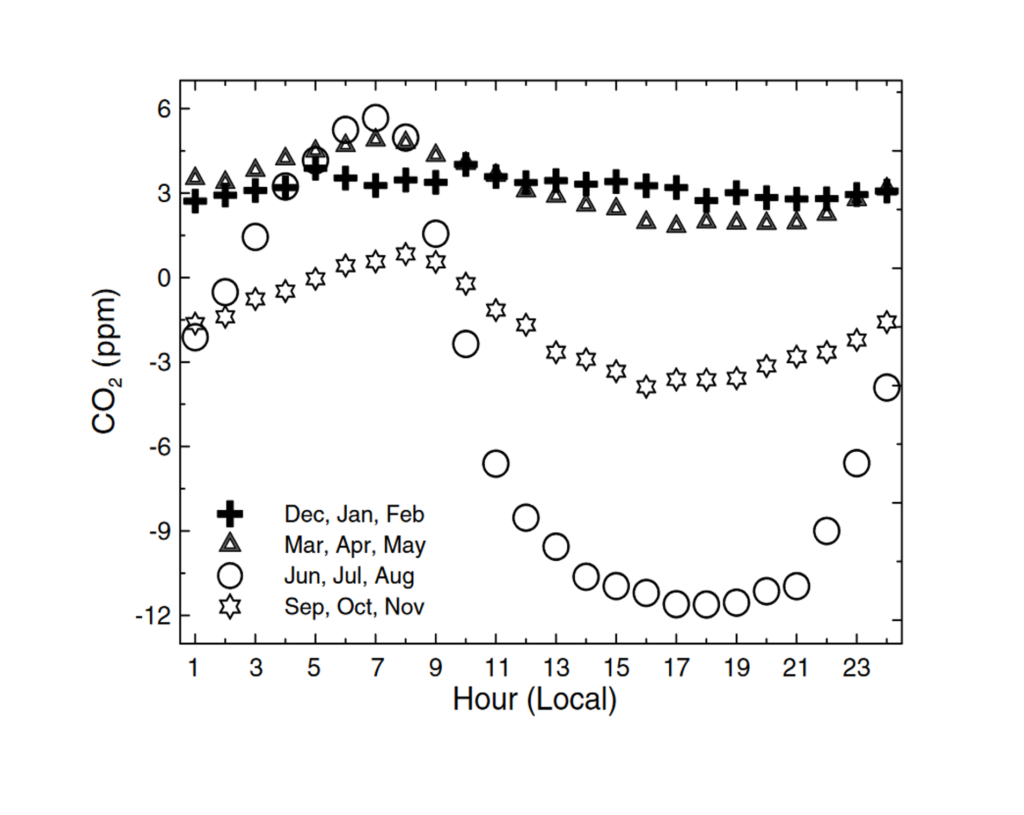
A relatively low level at Chapel Hill on Thursday in Phase 2 data (see explanation here). Today’s third graph is from Canada, this time a boreal forest rather than an urban area. Just as in Tokyo’s data (see yesterday’s post), the months of June, July and August show the biggest drops in the early afternoon, again photosynthesis effects the presumed cause, with sufficient mass of vegetation to appreciably lower CO2 levels. Higuchi, K., D. Worthy, D. Chan, and A. Shashkov. ‘Regional Source/Sink Impact on the Diurnal, Seasonal and Inter-Annual Variations in Atmospheric CO 2 at a Boreal Forest Site in Canada’. Tellus B: Chemical and Physical Meteorology 55, no. 2 (January 2003): 115–25. https://doi.org/10.3402/tellusb.v55i2.16752.
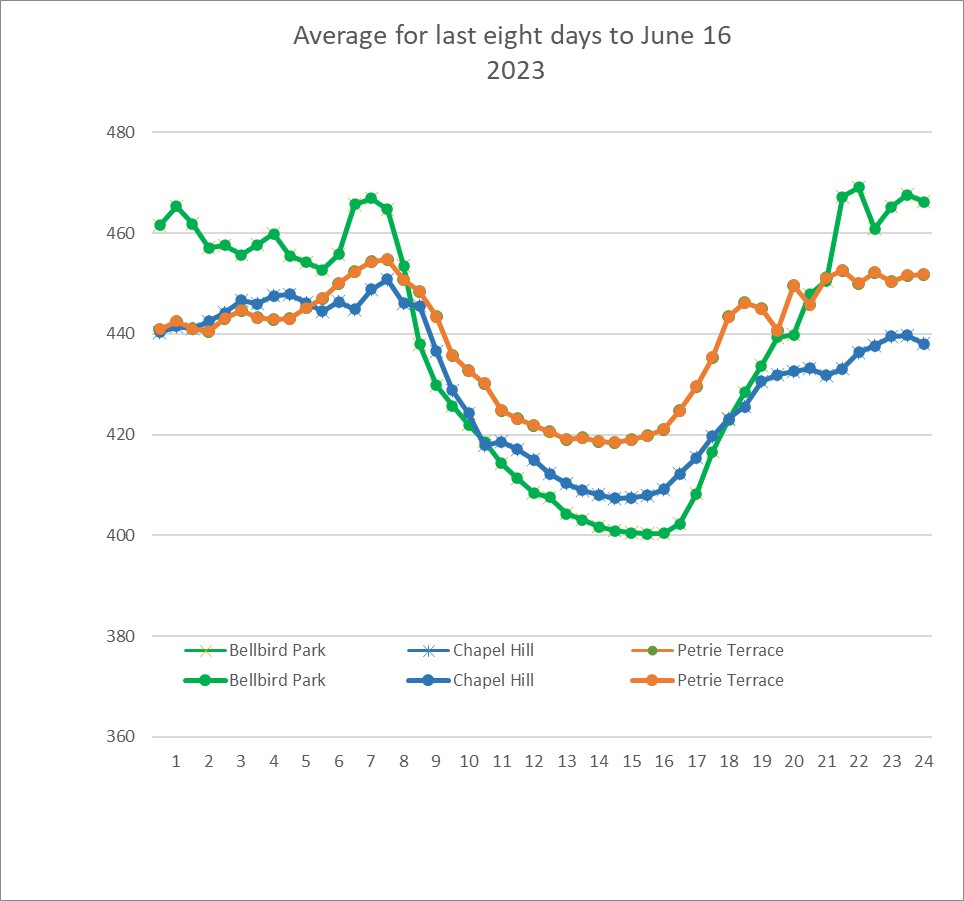
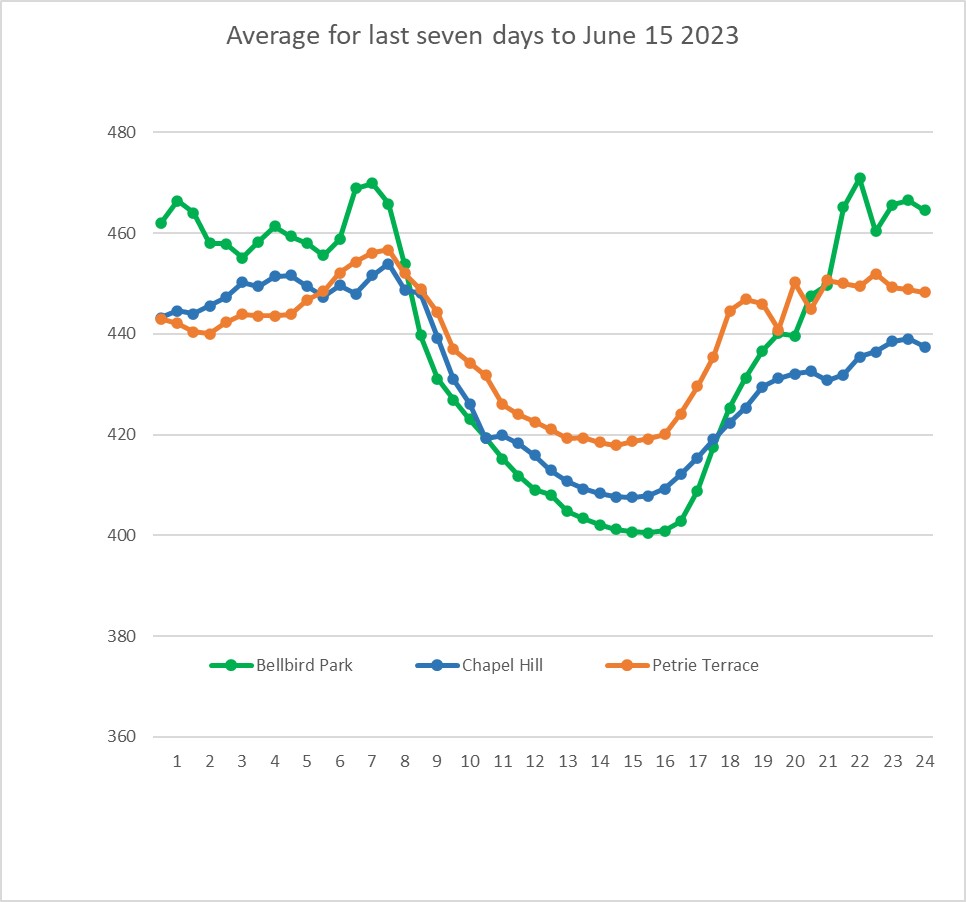
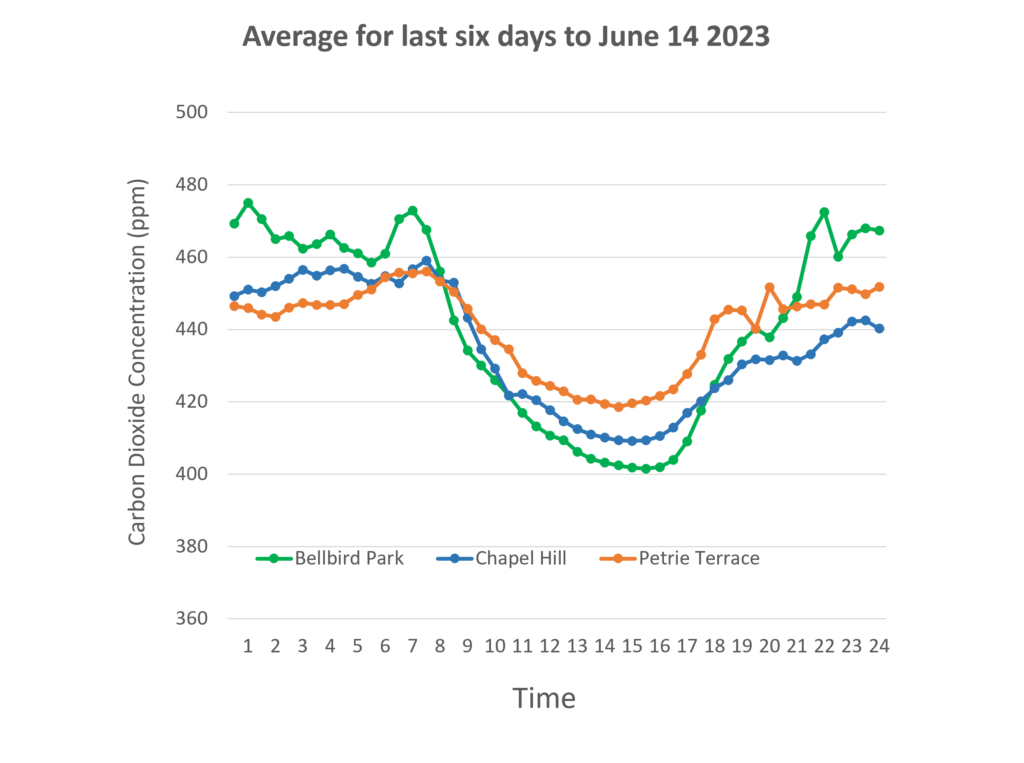
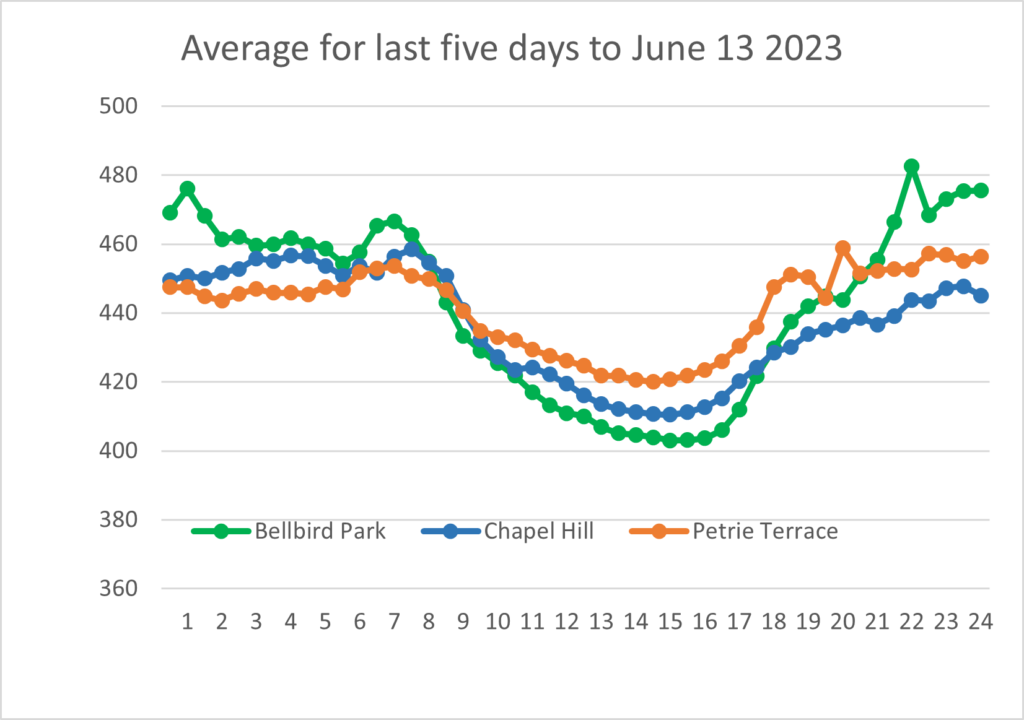
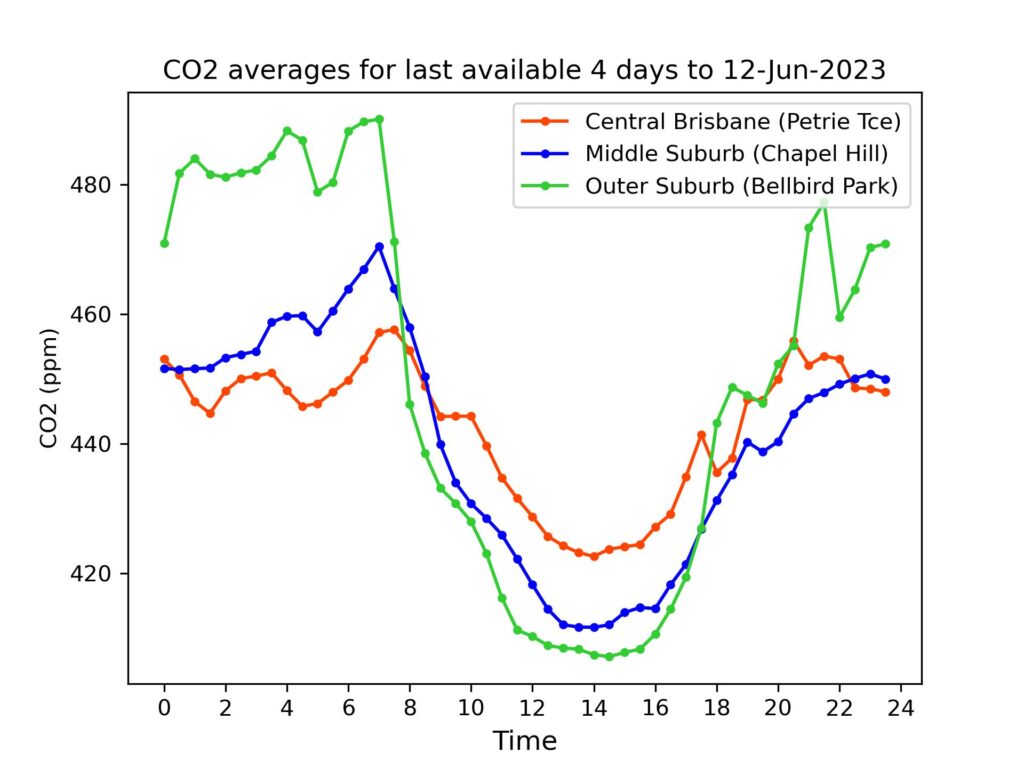
Daily Averages – Phase 2 (See explanation of differences between Phase 1 and Phase 2 data)
For reference, latest monthly average (Apr 2023) from CSIRO for Kennaook/Cape Grim in NW Tasmania was 415.4 ppm. (Note – these are provisional values, subject to revision folllowing sensor re-calibrations and other checks.)
| Date | Petrie Terrace | Chapel Hill | Bellbird Park |
| 16-Jun-2023 | 437 ppm | 423 ppm | 431 ppm |
| 15-Jun-2023 | 432 ppm | 413 ppm | 426 ppm |
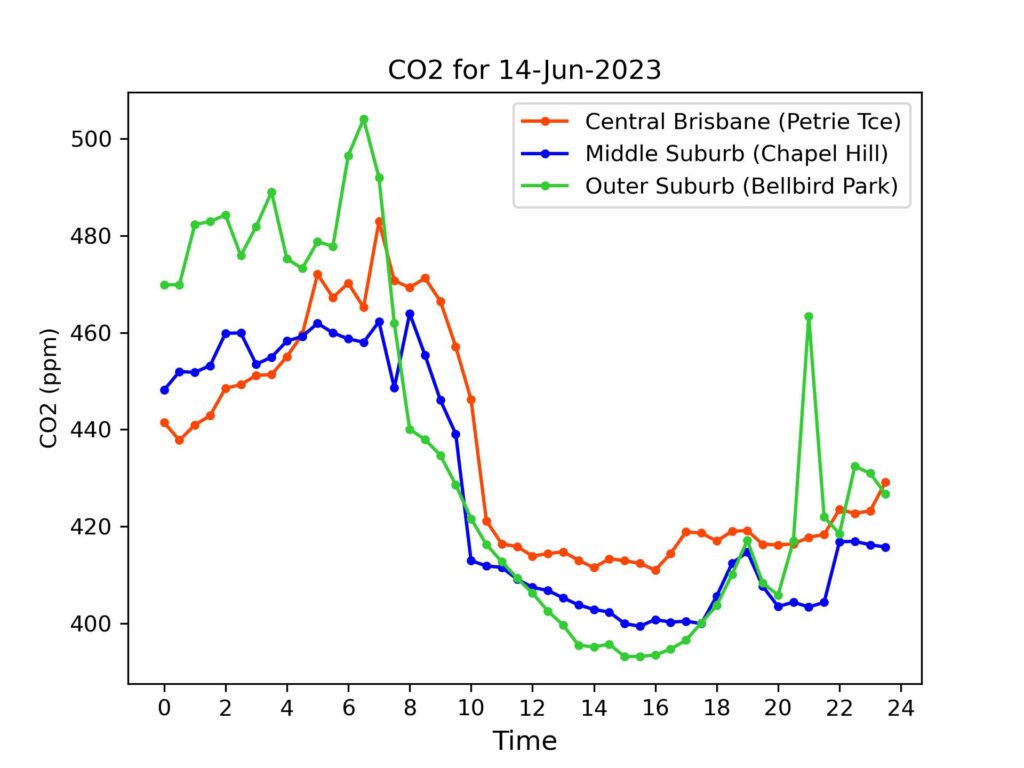
| 14-Jun-2023 | 435 ppm | 427 ppm | 436 ppm |
| 13-Jun-2023 | 441 ppm | 438 ppm | 440 ppm |
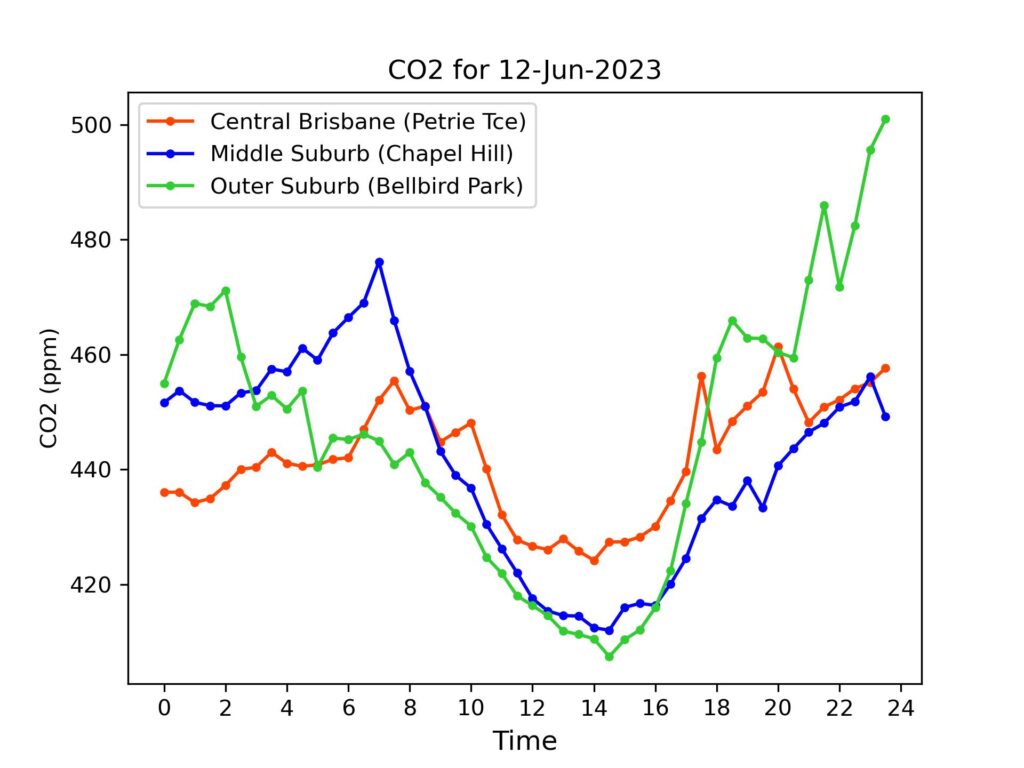
| 12-Jun-2023 | 442 ppm | 441 ppm | 446ppm |
| 11-Jun-2023 | 443 ppm | 443 ppm | 449 ppm |
| 10-Jun-2023 | 446 ppm | 434 ppm | 442 ppm |
| 9-Jun-2023 | 440 ppm | 430 ppm | 438 ppm |
Brisbane CO2 for 16 June 2023 Read More »